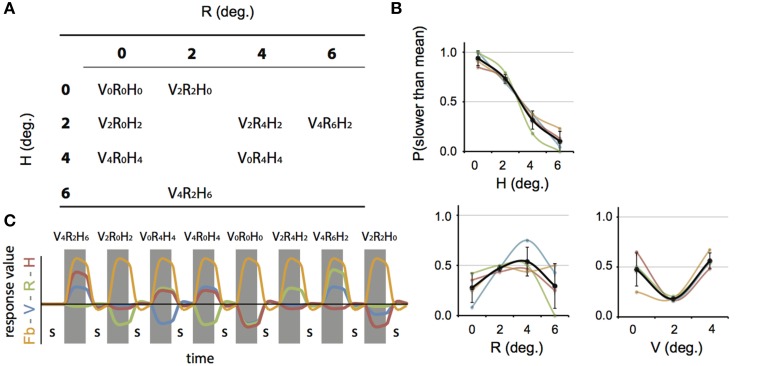
Figure 3.
Stimulus conditions, results perceptual study, and parametric GLM model. (A) Table of the 8 stimulus conditions, ordered by R and H amplitude. The combination of conditions allowed for a dissociation between contributions of V, R, and H to depth perception and the BOLD modulation. (B) Plotted are the average proportion of “slower” responses against the amplitude of H, R, and V (bold black line in left, middle, and right graph respectively). Individual results are drawn in colors. A clear monotonic decrease of slower responses occurs for increasing levels of H amplitude, but not for R and V. (C) Illustration of the time courses for the four experimental predictors of the 4P-model (confound predictors not shown), convoluted with the hemodynamic response function, used in the GLM analysis. In each run (156 volumes), all 8 conditions were presented, interleaved with a baseline condition (S, random static dot pattern). The Fb predictor captures modulation of the flow (orange). In addition, three parametric predictors (scaled with respect to their amplitude) fit modulations of the BOLD signal that are linearly related to changes in V (blue), R (green), or H amplitude (red). The parametric predictors are de-meaned to approximately orthogonalize the parametric predictors with one another.

