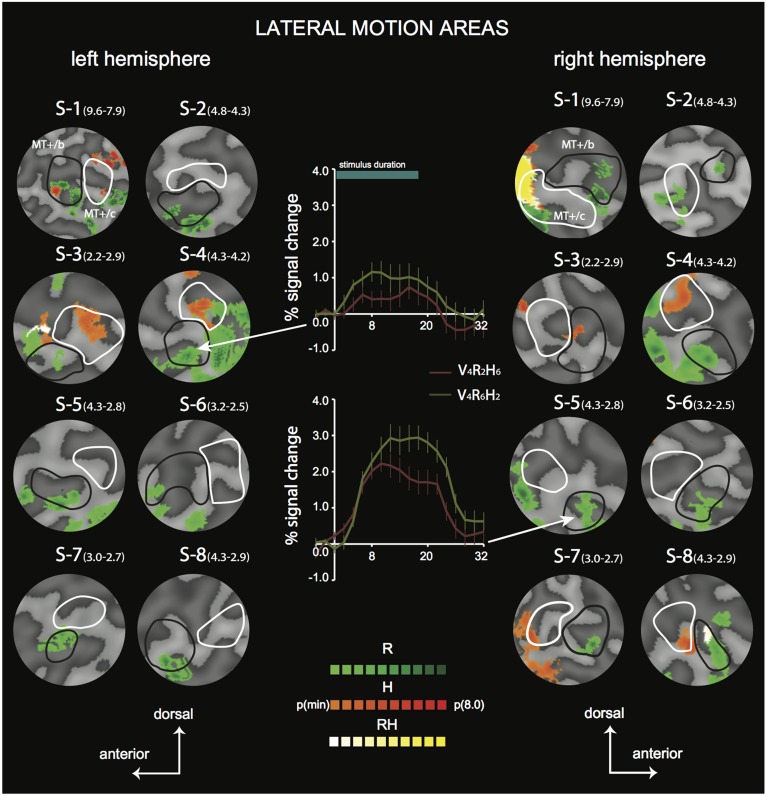
Figure 4.
Differential sensitivity to binocular signals in lateral motion areas. Sections of the flattened representation of all hemispheres, encompassing MT+/c (white outline) and MT+/b (black outline). On top, peak activations are drawn for R (green—dark green), H (orange—red), and RH (white—yellow). P(min) was set independently for each hemisphere to 75% of the p-value at which the most significant area of activation surfaced P(t)(min) values are given in parentheses following subject name. For example, P(t)(min) for S-1 are 9.6 for R contrast, and 7.9 for H contrast. Center graphs show the average BOLD response for two illustrative conditions (V4R2H6 and V4R6H2), in the R peak activation area indicated by the white arrows for S4-LH (upper graph) and S5-RH (lower graph). Error bars represent SEM.

