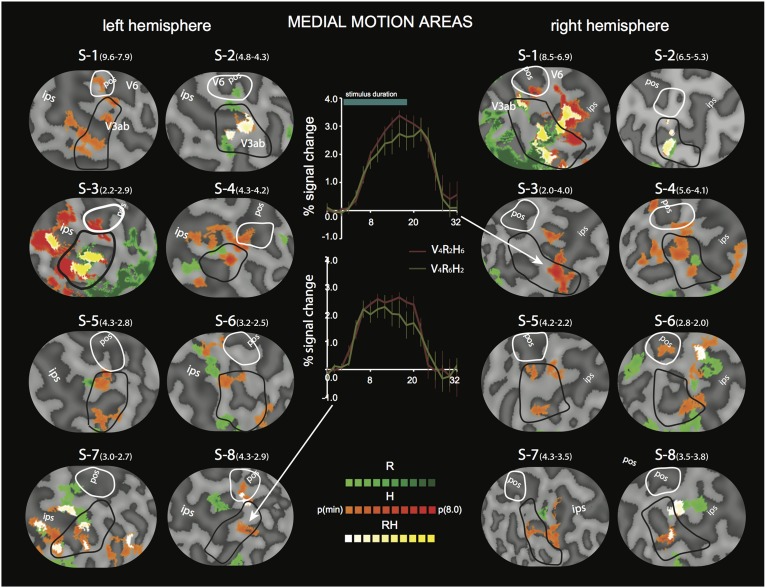
Figure 5.
Differential sensitivity to binocular signals in medial motion areas. Sections of the flattened representation of all hemispheres, encompassing V6 (white outline) and V3ab (black outline). On top, peak activations are drawn for R (green—dark green). H (orange—red), and RH (white—yellow). P(t)(min) was set independently for each hemisphere to 75% of the p-value at which the most significant area of activation surfaced. P(t)(min) values are given in parentheses following subject name. Center graphs show the average BOLD response for two illustrative conditions (V4R2H6 and V4R6H2), in the H peak activation area indicated by the white arrows for S3-RH (upper graph) and S8-LH (lower graph). Error bars represent SEM.

