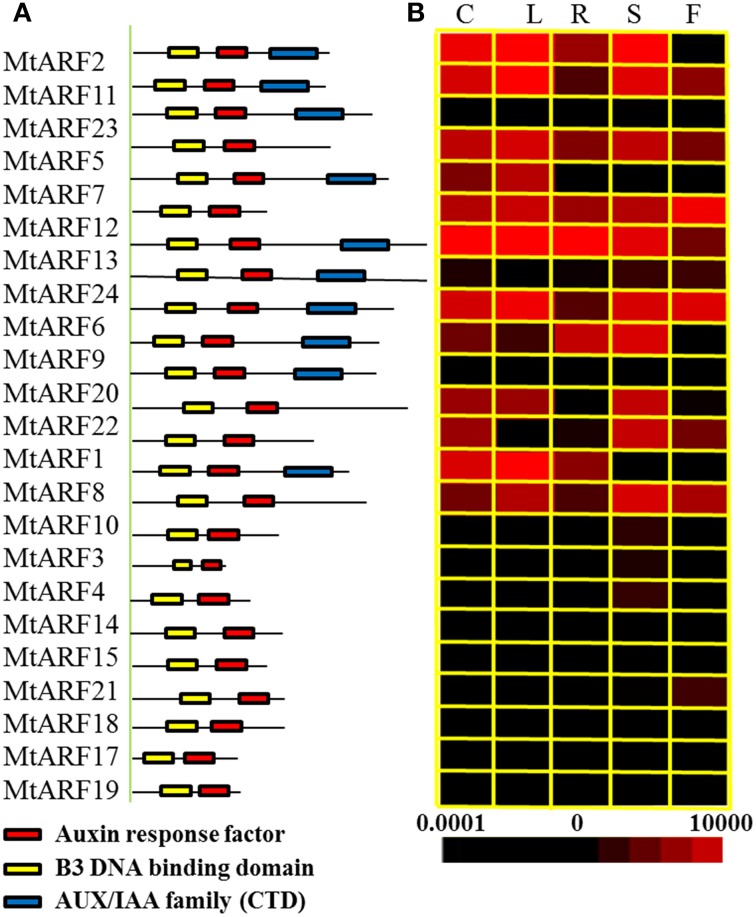
Figure 3.
Analysis of protein domains and tissue-specific expression patterns. (A) Depiction of the domain structure of the ARF protein sequences. The auxin response factor domain, B3 DNA binding domain and AUX/IAA family domain are colored in red, yellow, and blue, respectively. (B) Heat map representation for tissue-specific expression patterns of 24MtARF genes. C, cotyledon; L, leaf; R, root; S, shoot; F, flower. Expression patterns of the MtARF genes in five indicated tissues were determined using qRT-PCR. The different colors correspond to the values of the gene expression compare to MtACTIN shown in the bar at the bottom of figure. The color scale of each dendrogram represents expression values; black indicates a low level and red represents a high level of transcript abundance. The expression level of MtACTIN was defined as 1 × 10⁴.

