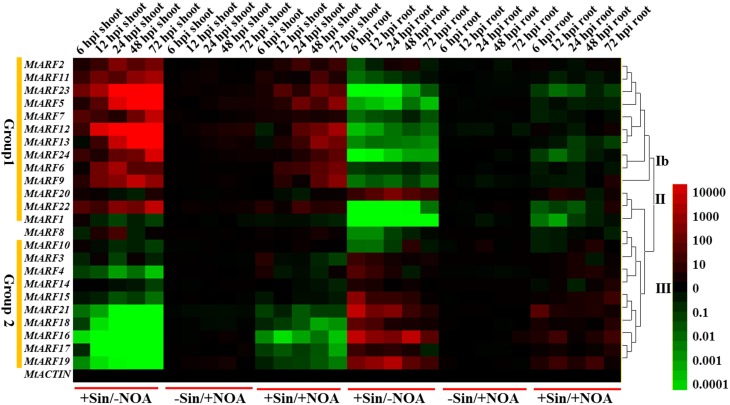
Figure 6.
Heat map showing MtARF gene expression patterns at the early phase of S. meliloti infection under different conditions. Samples of two different tissues (shoots and roots) were used to test the changes of MtARF gene expression levels at different time points (6, 12, 24, 48, 72 hpi) and conditions (–Sin/–NOA, +Sin/–NOA, –Sin/+NOA and +Sin/+NOA). The data of –Sin/–NOA was used as control. The different colors correspond to the values of the gene expression changes shown in the bar at the right of figure. The red color represents up-regulation expression, black represents unchanged expression level and green color represents down-regulation expression.

