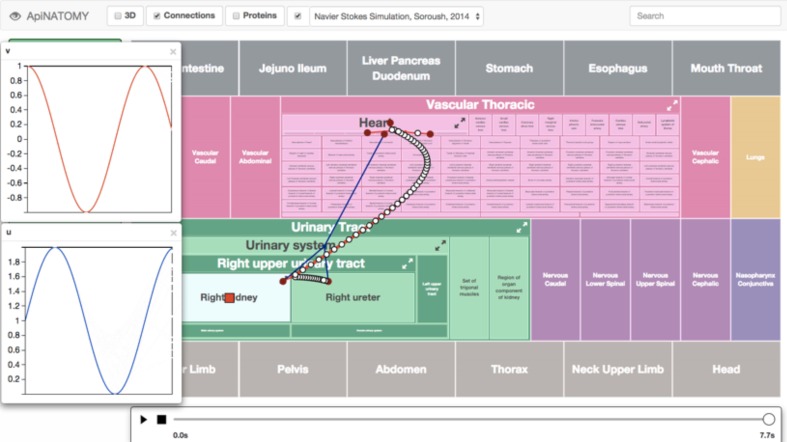
Figure 8.
Screenshot of an ApiNATOMY GUI displaying time-varying cyclical changes in blood pressure [v] and flow [u] in the kidney microcirculation. The arterial (red) and venous (blue) vascular routes connecting the heart to the kidney is also overlaid onto the circuitboard. A red box glyph representing RICORDO semantic metadata annotation is located in the Right Kidney tile (i.e., the location of the glyph represents the annotation of the model variable to the Right Kidney term in the FMA), and a number of glyphs are overlaid on the blood-vessel representations connecting the Right Upper Urinary Tract to the Heart. These glyphs are rendered on an SVG layer (scalable vector graphics), and each represents a specific variable. Clicking on them brings up a graph plotting that variable over time. The time dimension can be manipulated and traversed with the slider at the bottom.

