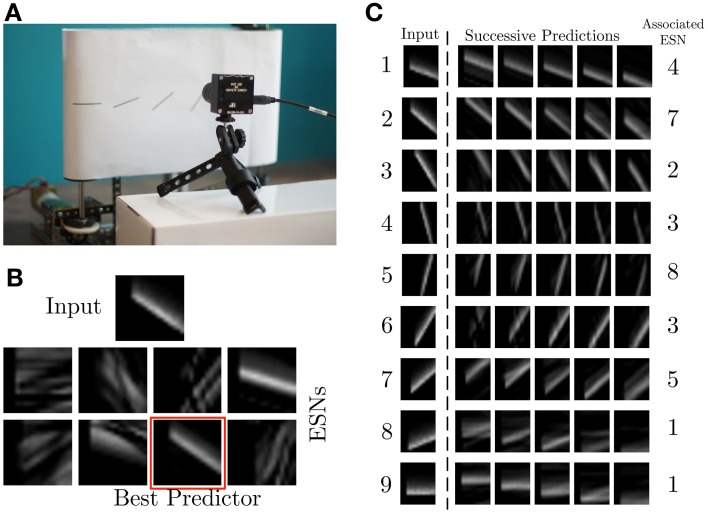
Figure 4.
Experimental recording setup. (A) A DVS records patterns moving on a treadmill. (B) Current input pattern (top) and predictions of the different ESNs at a given time. The best predictor is highlighted in red. (C) Results of ESN training. The left column shows a snapshot from each of the nine different patterns. The plots to the right show different predictions for different time steps in the future, obtained from the ESN which is specialized in the given pattern. The time difference between the five predicted patterns is 0.01 s.

