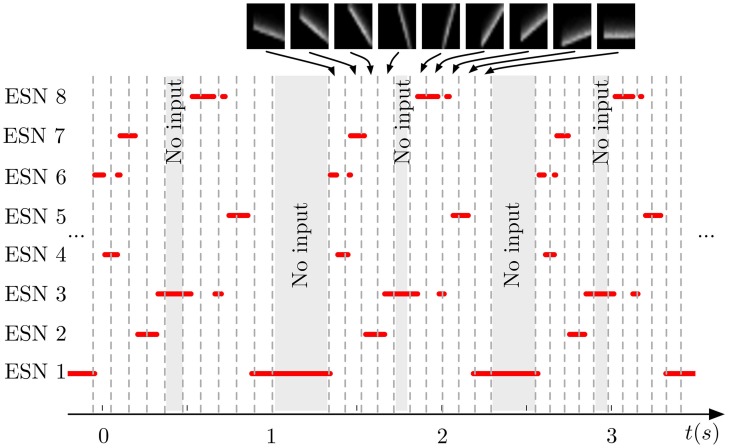
Figure 5.
Output of the WTA network during repeated presentation of a series of nine input patterns. Red lines indicate when an ESN was selected by the WTA network. Dashed vertical lines mark time points when the input presented to the DVS changed from one pattern to another (the 9 patterns are shown on top of the figure). Shaded areas indicate times when no stimulation was present. Every ESN learns to respond to only a small subset of input patterns (typically exactly one pattern). This response is reproducible over different stimulus presentations.

