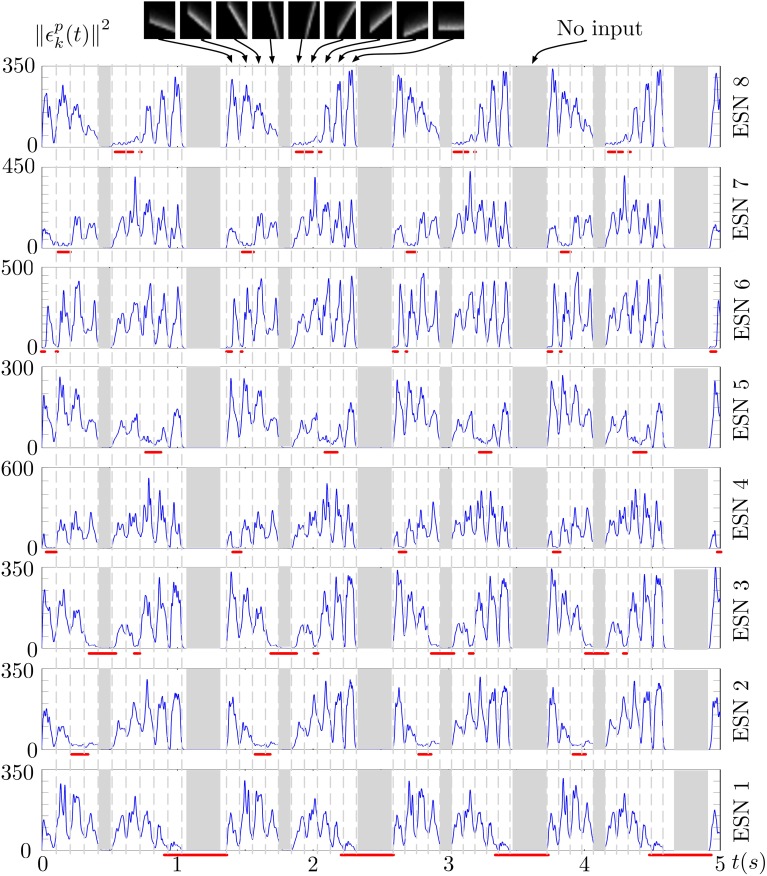
Figure 6.
Prediction error of the 8 ESNs during several presentations of the input stimulus. Red lines below each plot shows the output of the WTA neuron corresponding to each ESN, thus indicating times when each ESN was selected as the best predictor. We can observe that ESNs are correctly selected when their prediction error is minimal amongst all the networks.

