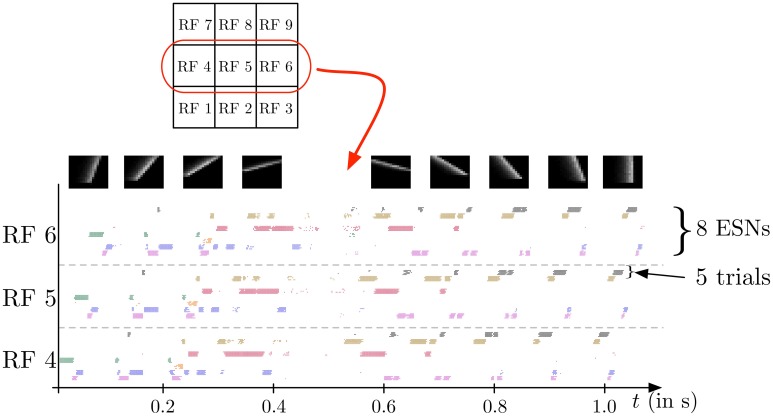
Figure 8.
Spike output for the WTA neurons corresponding to the eight ESNs for each of the 3 central RFs (see Figure 7) during the presentation of a series of 9 moving bars with different orientations (see snapshots on top). Dots indicate the times of output spikes for 5 repeated stimulus presentations, which are drawn on different coordinates along the y-axis, but grouped by WTA neuron. Each ESN, depending on its index in the RF, is associated with a color used to represent the dots corresponding to its output. The results show a highly reproducible response of the feature detectors for different trials, and also similar time delays for different stimulus presentations. Because the input stimulus moves horizontally, the outputs of the WTA circuits are similar, with a little time delay. Note that only one ESN can be active at any given time in each RF. Apparent simultaneous spikes from multiple WTA neurons are due to the scaling of time in the horizontal axis of the figure.

