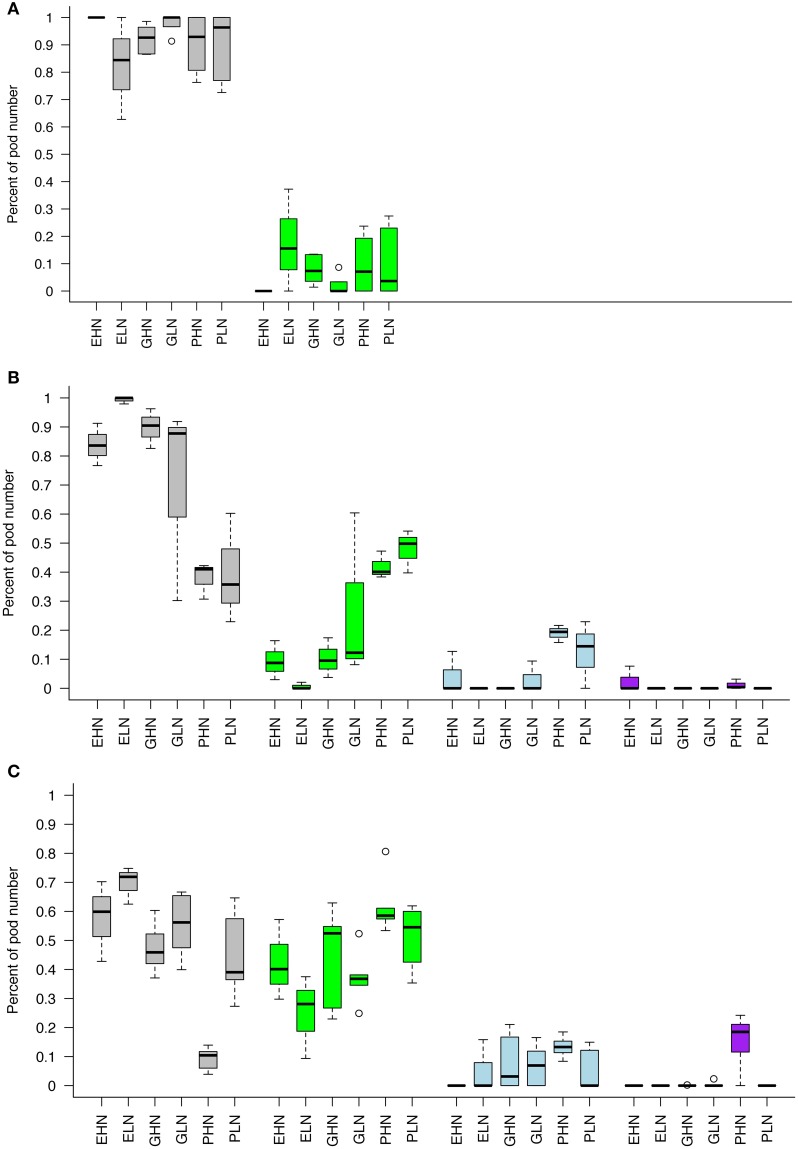
Figure 5.
Pods distribution between different axes of the plant for ClipFB. Control (A), ClipFB4 (B), and ClipFB7 (C). Gray boxplots correspond to pods of primary inflorescences carried by existing primary axes. Green boxplots correspond to pods of secondary inflorescences carried by existing primary axes. Blue boxplots correspond to pods of primary inflorescences carried by new primary axes. Purple boxplots correspond to pods of secondary inflorescences carried by new primary axes. Results are expressed as a percentage of the total number of pods. The meanings of the acronyms of the VN combinations are detailed in Table 1.

