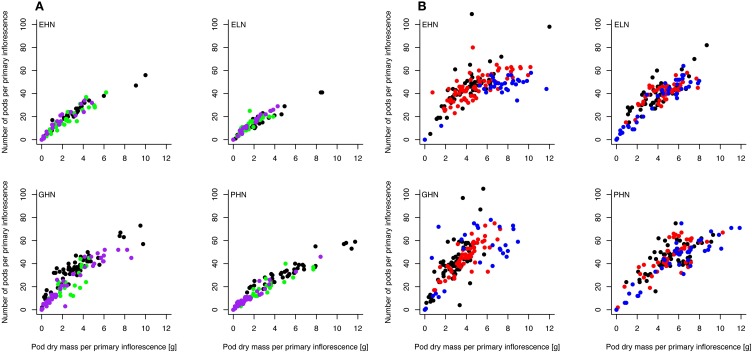
Figure 6.
Relationship between the number of pods and the total pod dry mass on the primary inflorescences for EHN, ELN, GHN, and PHN of ClipFB (A) and ClipInflo (B). Black, green and purple dots correspond to Control, ClipFB4 and ClipFB7 treatments, respectively. Black, red and blue dots correspond to Control, ClipI0 and ClipI4 treatments, respectively. The meanings of the acronyms of the VN combinations are detailed in Table 1. Linear mixed-models were used to assess the significance of the results.

