
Figure 1.
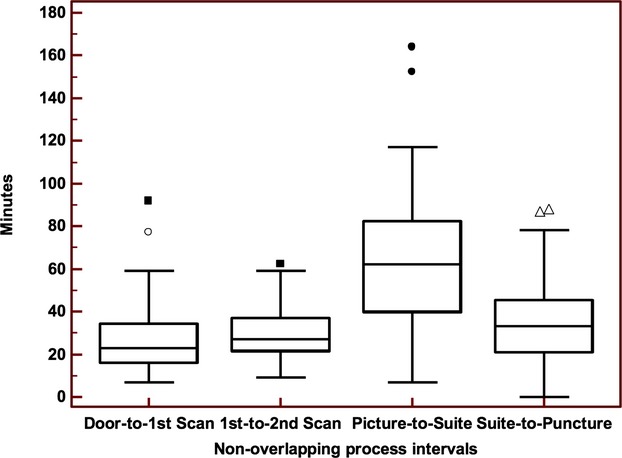
Identification of delays in pre‐QI cohort (sequential IAT process). Box‐whisker plots demonstrate median (line within box) and interquartile ranges (top and bottom edge of box) of the nonoverlapping process intervals. There was a significant difference among the intervals (overall P < 0.0001; Friedman's test). In pair‐wise comparison, the picture‐suite interval was significantly longer than the others (all P < 0.0001). IAT indicates intra‐arterial therapy; QI, quality improvement.