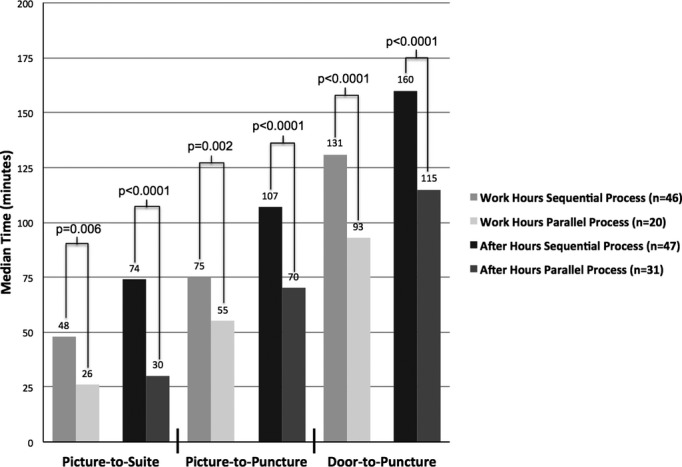
Figure 4.

Comparison of IAT processes based on time of day. Significant P values are shown comparing sequential and parallel processes based on time of presentation (Mann‐Whitney's U test). Median times are listed above the bars. IAT indicates intra‐arterial therapy.
