
Figure 5.
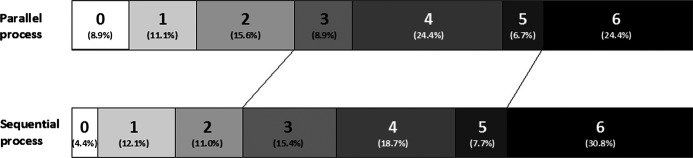
Distribution of modified Rankin Scale scores. Distributions of the Rankin scores are displayed for both the parallel and sequential process groups. The proportions are listed in parentheses.
Official websites use .gov
A
.gov website belongs to an official
government organization in the United States.
Secure .gov websites use HTTPS
A lock (
) or https:// means you've safely
connected to the .gov website. Share sensitive
information only on official, secure websites.
Distribution of modified Rankin Scale scores. Distributions of the Rankin scores are displayed for both the parallel and sequential process groups. The proportions are listed in parentheses.