
Figure 7.
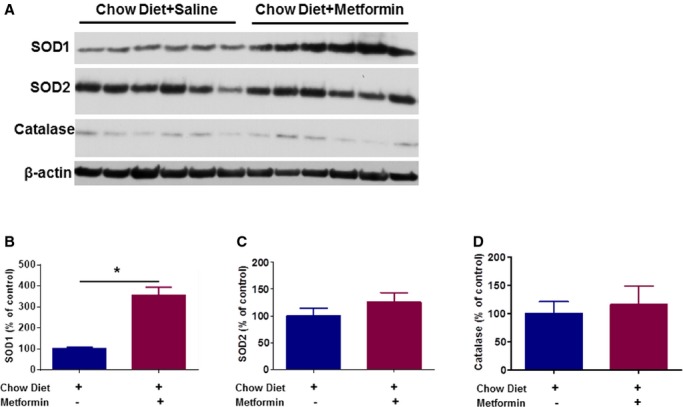
Metformin increases expression levels of SOD1, but not SOD2 or catalase, in aortas of ApoE−/− C57BL/6J mice fed chow diet. Western blot analyses for SOD1, SOD2, and catalase were performed on total cell lysates obtained from aortas of 3‐month‐old ApoE−/− C57BL/6J mice fed chow diet for 2 weeks in the absence and presence of metformin treatment (N=6 per group) (*P<0.05). SOD indicates superoxide dismutase.