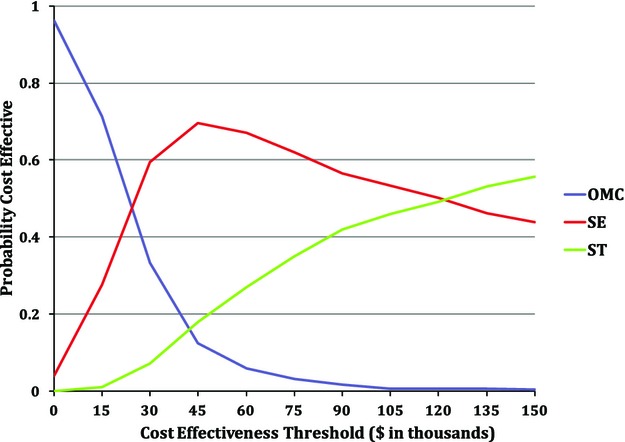
Figure 3.

Probabilistic sensitivity analysis. Starting with the base case assumptions, all model parameters were replaced with probabibility distributions that were sampled independently over many model iterations. The probability that each option would be preferred at a given willingness‐to‐pay threshold is plotted across a range of such thresholds. OMC indicates optimal medical care; SE, supervised exercise; ST, stenting.
