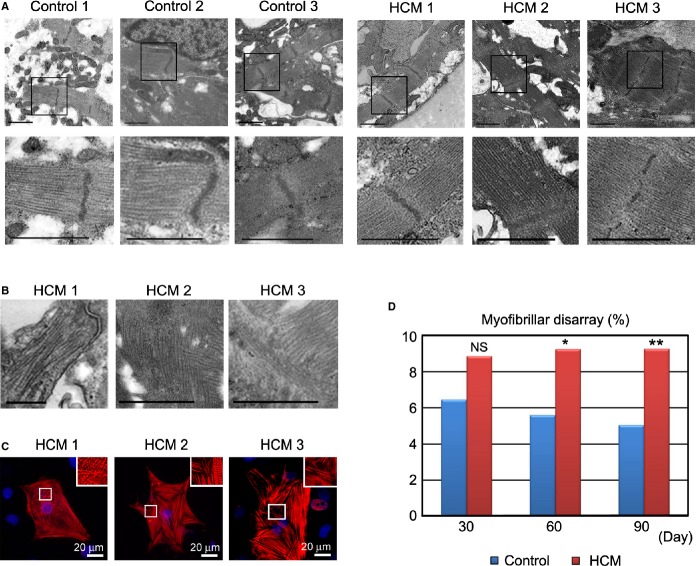
Figure 6.
Structural characterization of iPSC‐derived cardiomyocytes. A, Electron microscopic images showing well‐organized striated myofibrils derived from beating EBs from control and HCM iPSCs at 60 days after differentiation. Scale bars, 1 μm. B, Electron microscopic images showing myofibrillar disarray derived from beating EBs from HCM iPSC at 60 days after differentiation. Scale bars, 1 μm. C, Immunostaining for cTnT in the single cardiomyocytes at 60 days derived from each HCM iPSC, showing myofibrillar disarray. D, The percentages of cardiomyocytes with myofibrillar disarray were assessed by cTnT immunostaining of the single cardiomyocytes. N=851 to 995. *P<0.05, **P<0.01 vs control in the same time point (χ2 test). cTnT indicates cardiac troponin T; EBs, embryoid bodies; HCM, hypertrophic cardiomyopathy; iPSC, induced pluripotent stem cell.

