Figure 15.
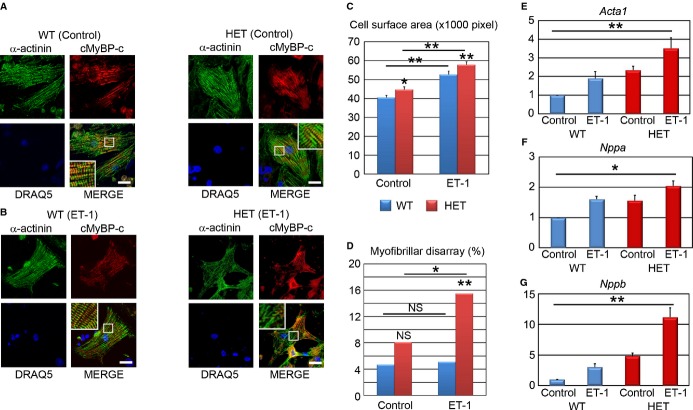
ET‐1 augments the incidence of myofibrillar disarray in cardiomyocytes isolated from heterozygous Mybpc3‐targeted knock‐in mice. A, Immunostaining for α‐actinin and cMyBP‐C with DRAQ5 nuclear staining of cardiomyocytes derived from neonatal wild‐type (WT) and Mybpc3‐targeted heterozygous knock‐in (HET) mice. Scale bars, 20 μm. B, Immunostaining for α‐actinin and cMyBP‐C with DRAQ5 nuclear staining of the single cardiomyocytes derived from WT and HET mice, which were cultured with ET‐1 for 48 hours. Scale bars, 20 μm. C, Cell surface areas of 173 to 178 randomly chosen α‐actinin–positive cardiomyocytes in each condition were measured. *P<0.05, **P<0.01 vs WT or as indicated on the figure (Mann–Whitney U test). D, The percentages of cardiomyocytes with myofibrillar disarray were assessed by immunostaining for α‐actinin of the single cardiomyocytes. N=215 to 236. *P<0.05, **P<0.01 vs WT or as indicated on the figure (χ2 test). E through G, Quantitative RT‐PCR analyses for Acta1, Nppa, and Nppb. N=3 to 5. *P<0.05, **P<0.01 (Kruskal–Wallis test). Acta1 indicates α‐skeletal muscle; cMyBP‐C, cardiac myosin‐binding protein C; ET‐1, endothelin‐1; Mybpc3, human/mouse gene encoding cardiac myosin‐binding protein C; Nppa, natriuretic peptide type A; Nppb, natriuretic peptide type B; RT‐PCR, reverse transcription‐polymerase chain reaction.

