
Figure 16.
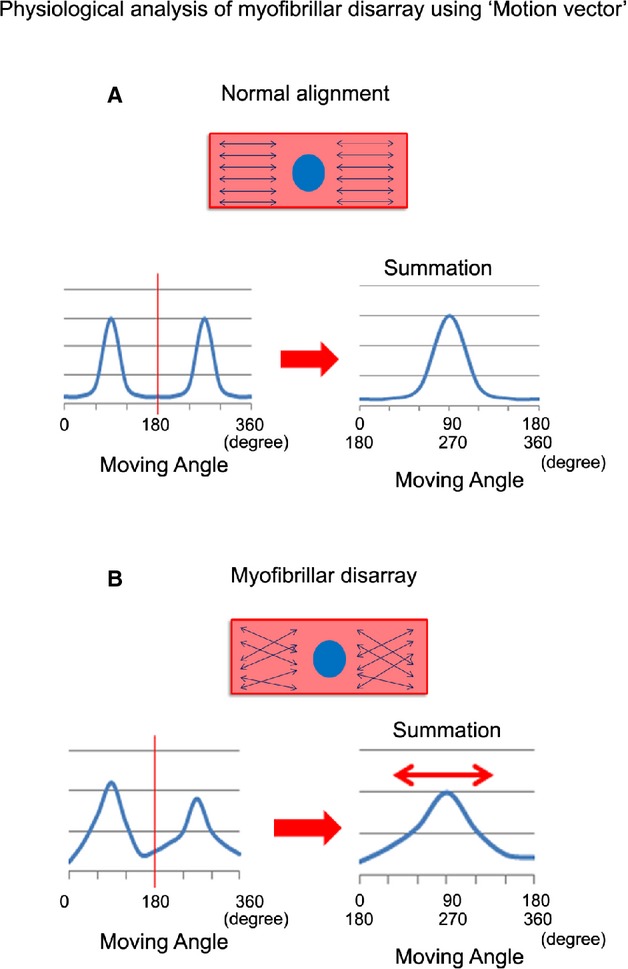
Schema of motion vector analysis for single beating cardiomyocytes. A, Normal cardiomyocytes, beating synchronously in 1 direction, show symmetrical twin peaks under 360° analyses. The summation data indicates a single peak with lower SD scores. B, Cardiomyocytes with myofibrillar disarray, beating nonsynchronously, show ≥2 morphologically irregular peaks under 360° analyses. The summation data indicate flattened peak with higher SD score (double‐headed red arrow).