
Figure 7.
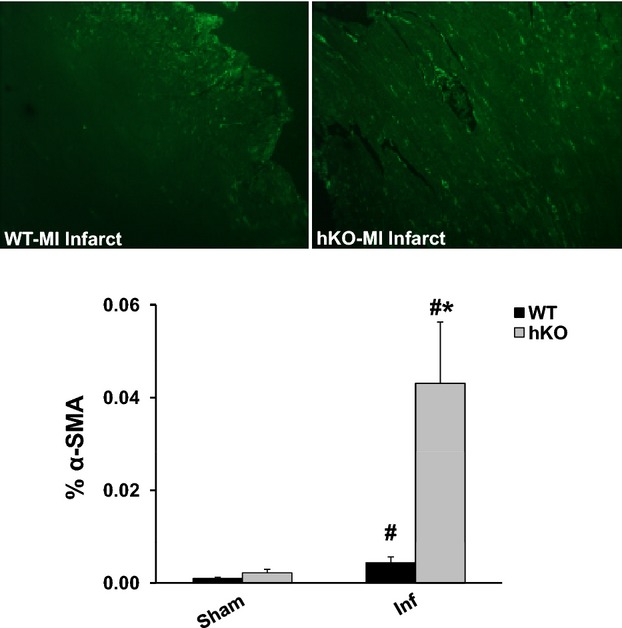
Quantitative analysis of α‐smooth muscle actin (α‐SMA) expression. Cross‐sections of the heart were immunostained using anti‐α‐SMA antibodies. Upper panel depicts α‐SMA‐stained images from the infarct (Inf) LV regions of WT and hKO hearts 3 days post‐MI. Lower panel exhibits quantitative immunocytochemical analysis of α‐SMA in sham and Inf LV regions 3 days post‐MI. #P<0.05 vs Sham, *P<0.05 vs WT‐Inf; n=4 to 5. hKO indicates heterozygous knockout; LV, left ventricle; MI, myocardial infarction; WT, wild‐type.