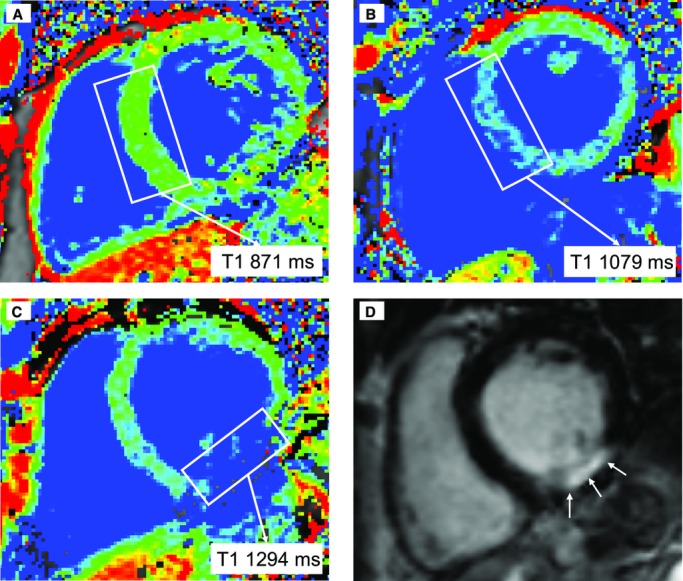
Figure 1.

Examples of precontrast T1 quantification. Blue color reflects high T1 values, and areas depicted in green or red have lower T1 values. Whereas in A the T1 value in the septum is low (871 ms, green), in B an increased septal T1 can be found (1079 ms, blue). Finally, C and D correspond to a patient with an inferior myocardial infarction: in C, a high T1 value in the infarcted area can be seen, while D demonstrates a hyperenhanced area in the inferior wall, corresponding to the infarction.
