Figure 4.

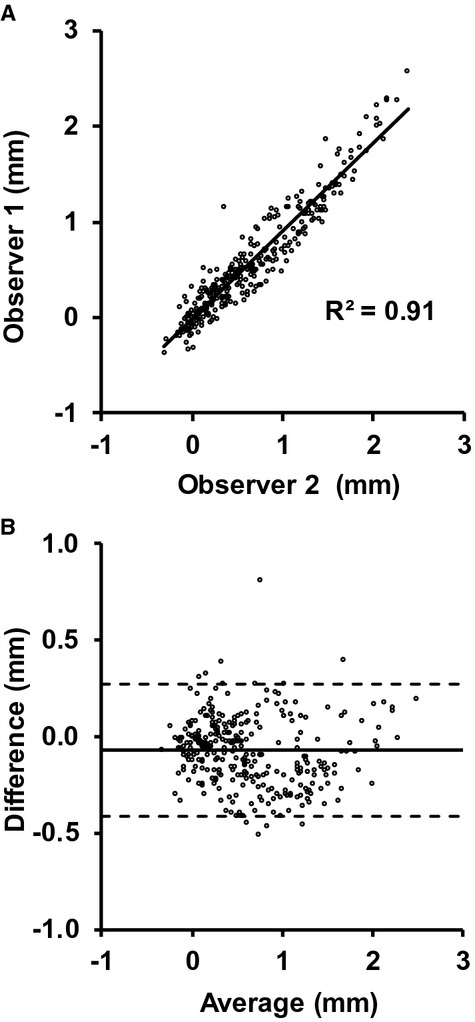
Scatter plot (A) and Bland–Altman plot (B) of the through‐plane diameter error for observer 1 and observer 2. The solid line in (B) represents the mean difference, and the 2 dotted lines represent the mean±2 SD. For reference, the average observed peak diameter in these cases was 33.2±3.7 mm.
