
Figure 6.
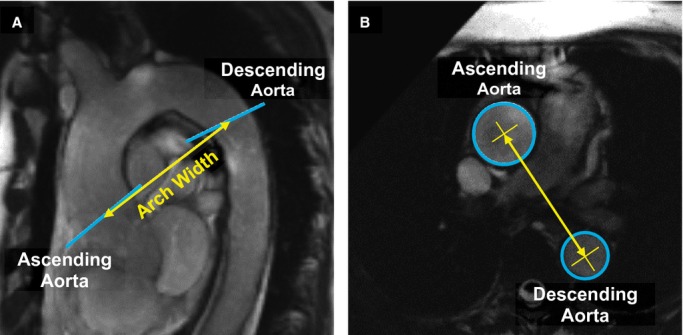
A, Sagittal oblique image of the thoracic aorta. Image planes for the ascending aorta and descending aorta are noted by blue lines. Aortic arch width (yellow line) was measured from ascending and descending aorta image planes. B, Cross‐sectional FIESTA of the ascending and descending aorta. Aortic arch width was calculated as the 3‐dimensional distance between centroids (yellow X) in the ascending and descending aorta lumen (blue circles). Lumen and centroids for the ascending and descending aorta were measured on different image planes, each orthogonal to the local aortic segment, but are shown on a single image here for clarity. FIESTA indicates fast imaging employing steady‐state acquisition.