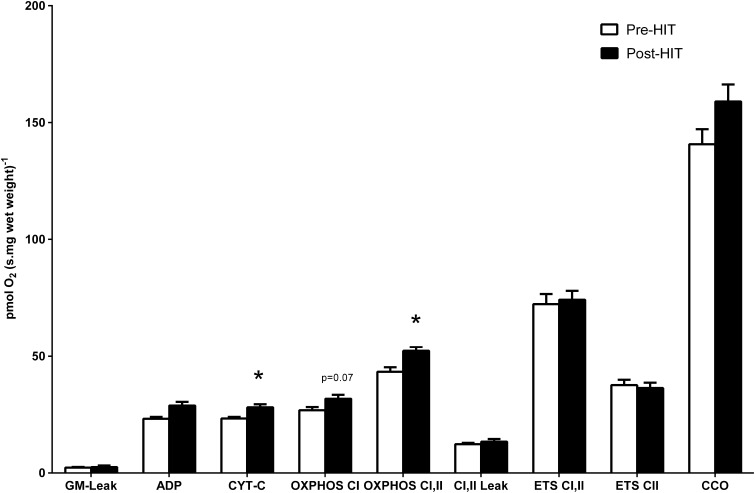
Figure 2.
In response to HIT, respiratory flux showed elevation of CYT-C and OXPHOS CI, II. *Denotes significance (P < 0.05), error bars represent SEM, n = 8. Note that the statistical significance reported in the figures is based on analysis of the transformed data but the reported means ± SEM are on the original (untransformed) scale.

