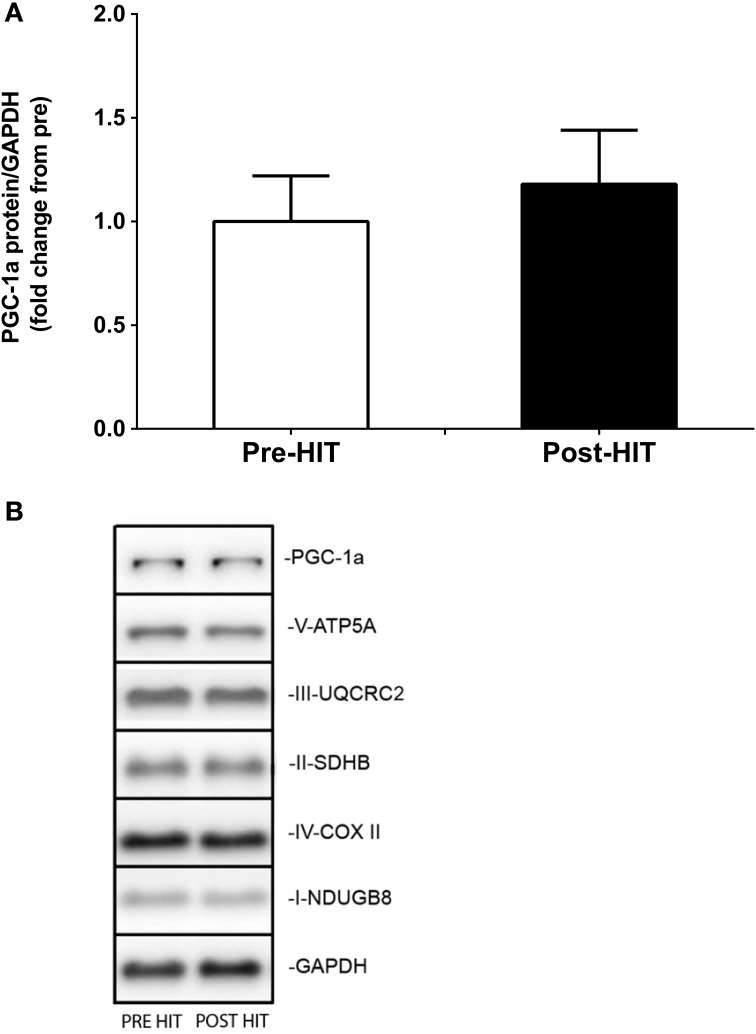
Figure 3.
Immunoblot analysis of the PGC-1α protein expression in response to HIT. Mean ± SEM PGC-1α protein expression (n = 8) pre- and post-training. Note that the statistical significance reported in the figures is based on analysis of the transformed data but the reported means ± SEM are on the original (untransformed) scale. (A) Representative western blot images of the following proteins: PGC-1α, V-ATP5A, III-UQCRC2, II-SDHB, IV-COX II, I-NDUGB8, GAPDH whole muscle homogenates, pre- and post-HIT for one subject (B).

