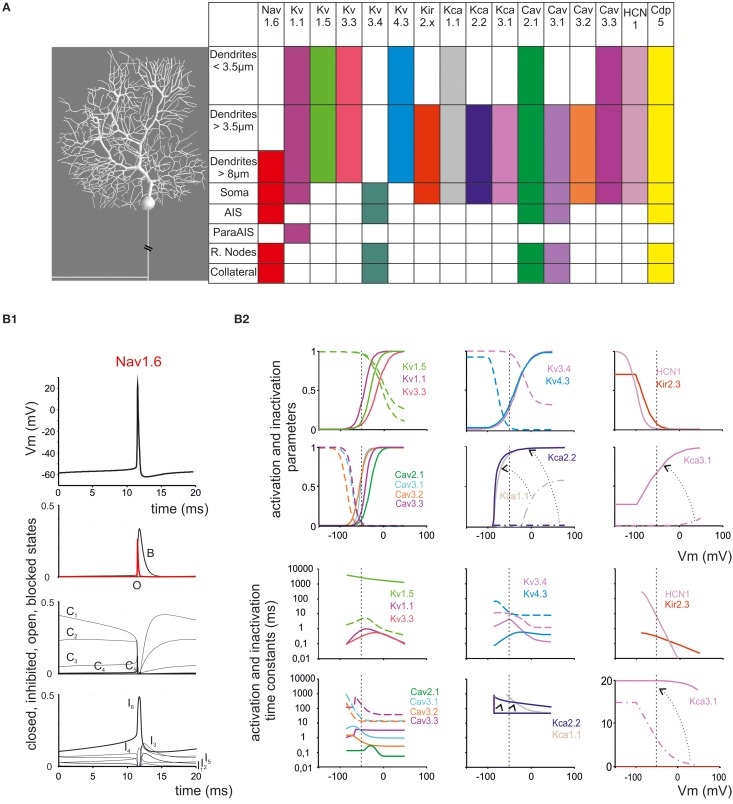
Figure 1.
Ionic channel types, distribution and gating properties in the PC model. (A) Left: schematic drawing showing the morphology of the PC model reconstructed according to data reported in Table 1. Right: the PC model is divided into eight electrotonic sections and endowed with specific ionic mechanisms according to immunohistochemical data. Ionic channels include Na, K and Ca channels (Nav1.6, Cav2.1, Cav3.1, Cav3.2, Cav3.3, Kv3.4, Kv1.1, Kv4.3, Kv1.5, Kv3.3, KCa1.1, KCa3.1, KCa2.2, Kir2.x, HCN1) and a Ca buffering system (CDP5). (B) Ionic channel gating parameters are shown according to equations reported in Tables 2, 3. (B1): state variables of the Nav1.6 channels during an action potential. C, I, O, B, indicate closed, inactivated, open and blocked states. (B2) Steady-state activation and inactivation parameters (top) and activation and inactivation time constants (bottom) for Ca and K channels. For Kca3.1, Kca1.1, and KCa2.2, two gating curves are shown and arrows indicate gating occurring when changing Ca concentration (Kca1.1 and KCa2.2 from 0.045 μM to 1.6 μM Ca; KCa3.1 from 0.045 μM to 10 μM Ca; cf. Figure 6). Continuous lines indicate activation, broken lines indicate inactivation (when present). Same colors as in panel (A). Vertical dashed lines indicate the approximate action potential threshold (−50 mV).

