Figure 6.
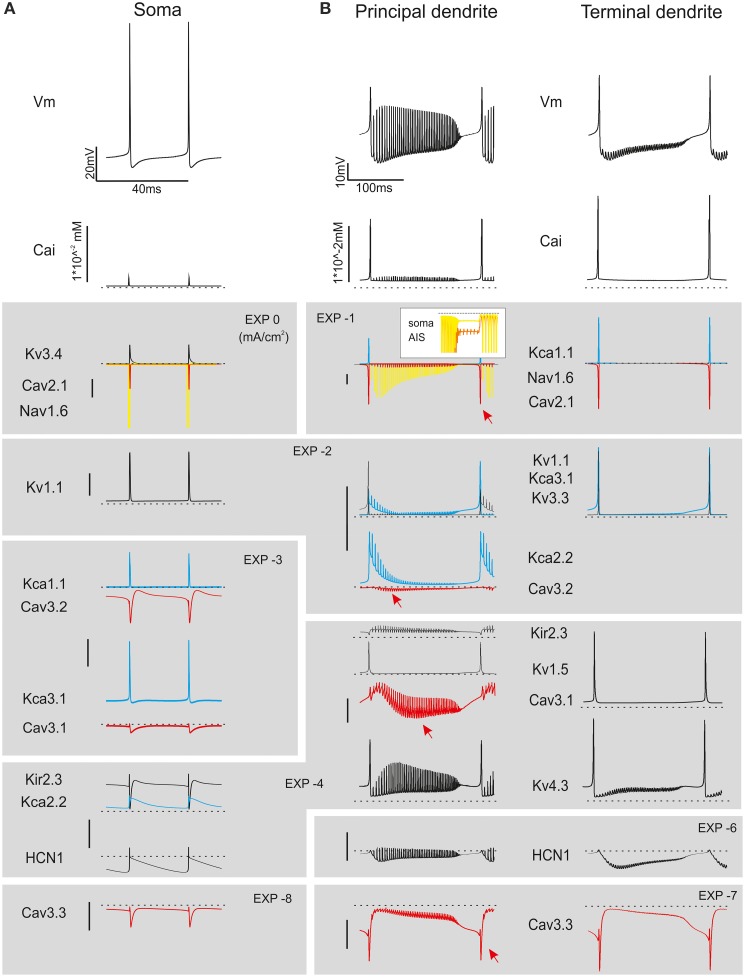
Ionic currents during simple spike firing and complex bursting. Membrane potential, calcium concentration and ionic currents during simple spike firing and complex bursting. (A) Traces show ionic currents in the soma during spontaneous firing. (B) Traces show ionic currents in the principal dendrites (>8 μm) and terminal dendrites (<3.5 μm) during complex bursting (2.2 nA current injection). It should be noted that several spike-related currents are larger in terminal than proximal dendrites reflecting the dendritic generation mechanisms involved in complex bursting. The inset shows soma and AIS Nav1.6 current that can back-propagate into the dendrites sustaining complex bursting. Both in A and B, colors are used to better identify certain currents (yellow for Nav1.6, red for Ca currents, blue for Kca currents). Arrowheads point to the peak of LVA currents. Currents are grouped and ordered from largest (top) to smallest (bottom) according to a logarithmic scaling of calibration bars.

