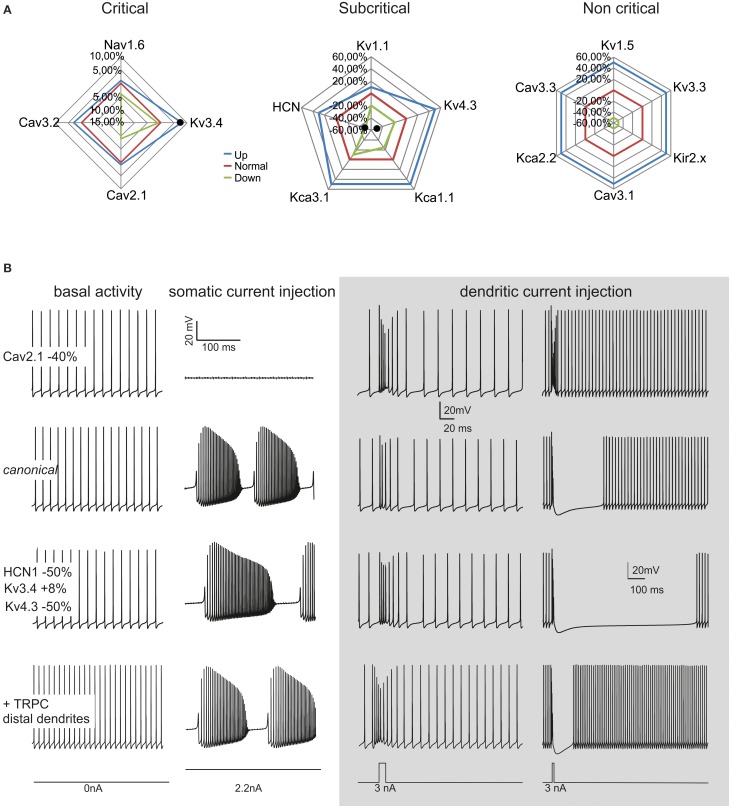
Figure 8.
Model robustness. Robustness of the canonical PC neuron and variant PC firing patterns. (A) The graphs show the fluctuation ranges of maximum ionic channel conductances needed to maintain the model within PC physiological response limits. The channels have been grouped into critical, subcritical, non-critical. The lines indicate the standard (red), minimum (green) and maximum (blue) values allowed. (B) The model was changed to simulate a CF-PC (−40% Cav2.1), a P-PC (HCN1 −50%, Kv3.4 +8%, Kv4.3 −50%) and a Z- PC (TRP channels in the dendrites). The traces show spontaneous firing and complex bursting in the different cases. Gray panel: model responses to dendritic current injection (3 nA/10 ms in terminal dendrites, 3 nA/30 ms in dendritic trunck) in the different cases. Note the similarity of these responses with those typical generated by parallel fibers and climbing fibers activity.

