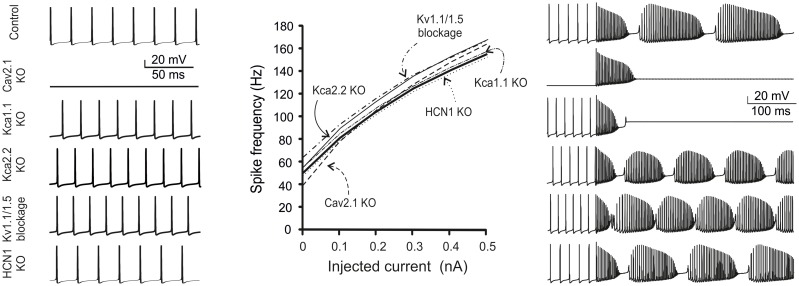
Figure 9.
Ionic channel mutations and modulation in the model. The figure shows simulations of changes in firing pattern caused by gene mutations or pharmacological inhibition of PC ionic channels. Traces show model spontaneous firing (left) and complex bursting (right; 2 nA current injection). The plot shows the frequency-intensity relationships in the different cases. From top to bottom: Nav1.6 switch-off fully abolished firing; Cav2.1 switch-off prevented spontaneous firing and complex bursting; Kca1.1 switch-off prevented complex bursting; Kca2.2, Kv1.1, and Kv1.5 switch-off caused a slight increase in spontaneous and evoked firing; HCN1 switch-off did not alter spontaneous and evoked firing remarkably.

