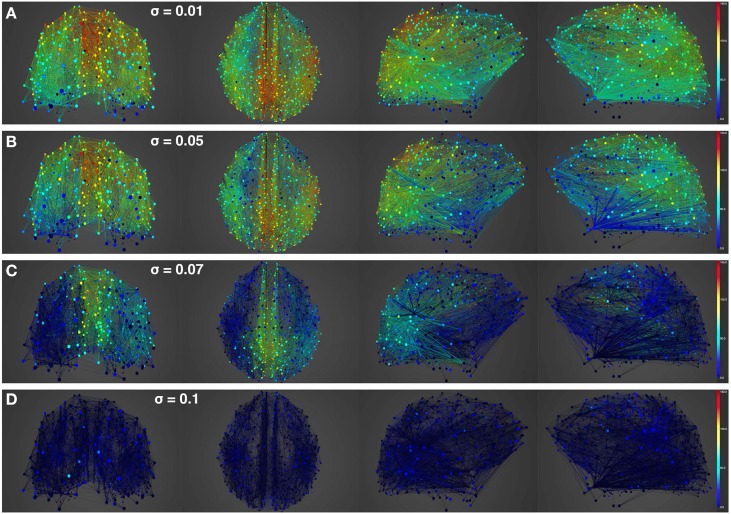
Figure 8.
Simulation of lesioned (diffuse) brain activity vs. noise. Snapshot of neural activity at a single time-point in BrainX3 following a diffuse lesion. The lesion was simulated by disconnecting 50 randomly selected nodes. From top to bottom, noise amplitudes: (A) 0.01, (B) 0.05, (C) 0.07, and (D) 0.1. Each row shows screenshots from the posterior, superior and lateral perspectives. The color bar on the right represents neuronal activity in Hz (warmer colors represent higher activation of the nodes and lesioned nodes are shown in black).

