FIGURE 2.
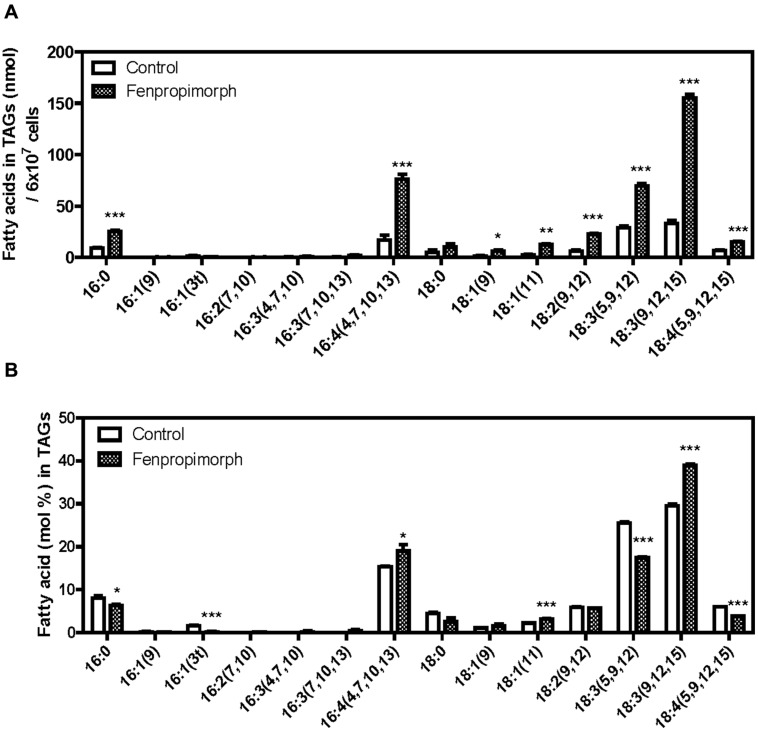
Biochemical analysis of TAGs in fenpropimorph-treated C. reinhardtii in late mid-log phase culture in TAP medium (N+, acetate). (A) A comparison of the absolute amount of fatty acids in TAGs isolated from fenpropimorph-treated and control cells. Averages from three replicate experiments are presented. Bars represent SE. Significant differences, as determined by Student’s t-test, are indicated by asterisks (*p < 0.05, **p < 0.01, ***p < 0.001). (B) Comparison of fatty acid mol% in TAGs isolated from fenpropimorph-treated cells and control cells. Averages from three replicate experiments are presented. Bars represent SE. Significant differences, as determined by Student’s t-test, are indicated by asterisks (*p < 0.05, **p < 0.01, ***p < 0.001).

