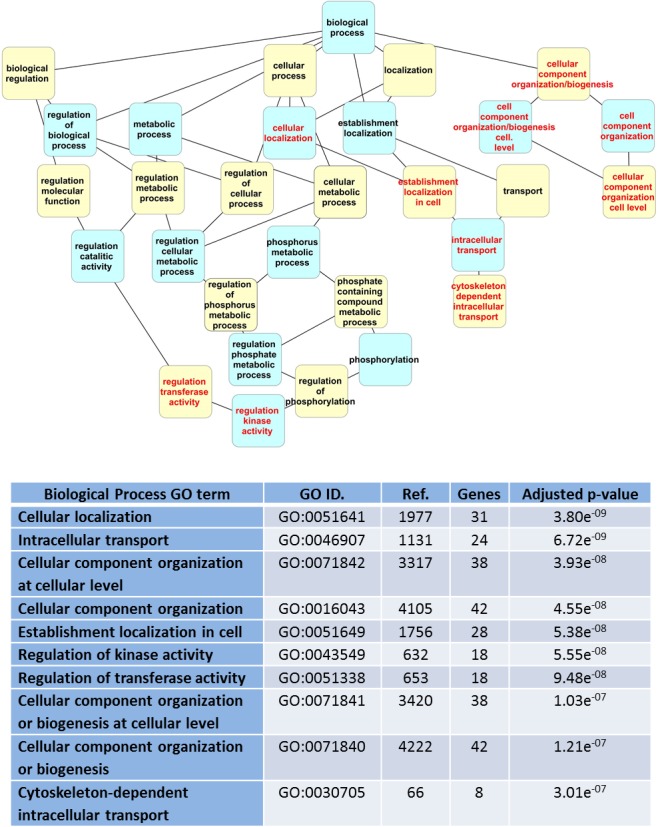
Figure 4. Dendrogram of “GO biological process” terms enriched for LRRK2 interactors in WebGestalt.

Hierarchical levels of the dendrogram are alternatively represented in blue and yellow; red text indicates the top 10 GO terms. The table lists details of the enriched terms: GO term and ID, number of proteins in the GO term category (Ref.), number of LRRK2 interactors associated with the GO term (Genes), p-value adjusted for multiple testing.
