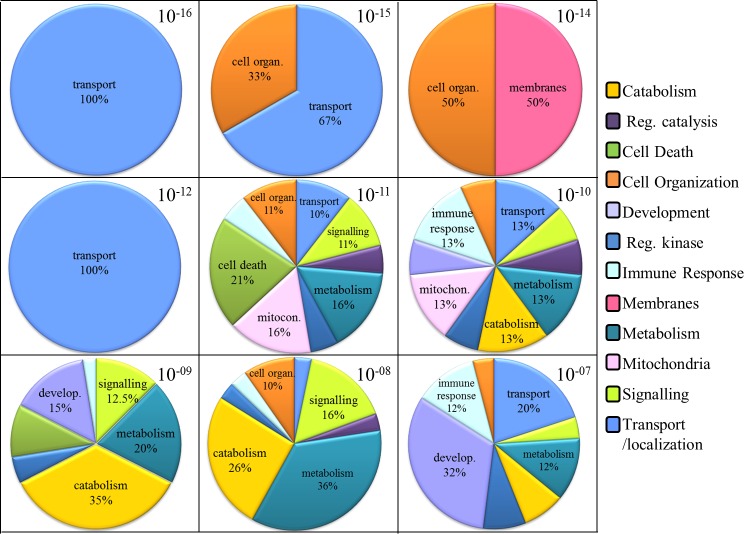
Figure 7. “GO biological process” terms enriched for LRRK2 interactors in GO supported by Panther.
Pie charts showing the composition of every significance level of enrichment. The legend shows the 12 GO term groups, although in the charts the group name was reported only for those that reached the 10% contribution toward the enrichment.

