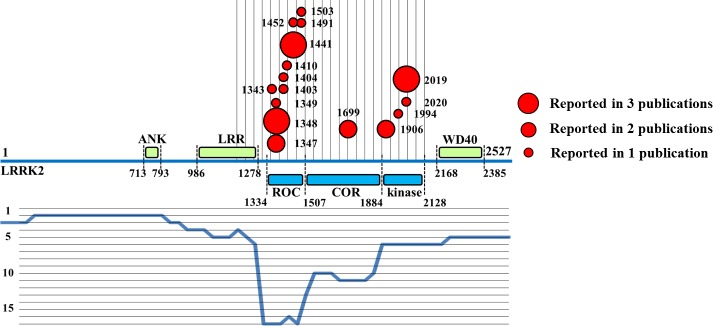
Figure 9. Profile of LRRK2 self-interaction.

Each residue described as involved in LRRK2 self-interaction is reported with a dot, the dimension of the dot is proportional to the number of publications annotating that specific residue. A profile covering the entire length of the LRRK2 protein is shown in blue, in the bottom half of the image; the y value of the profile represents the number of publications in which the fragment in the profile was reported as associated with LRRK2 self-interaction.
