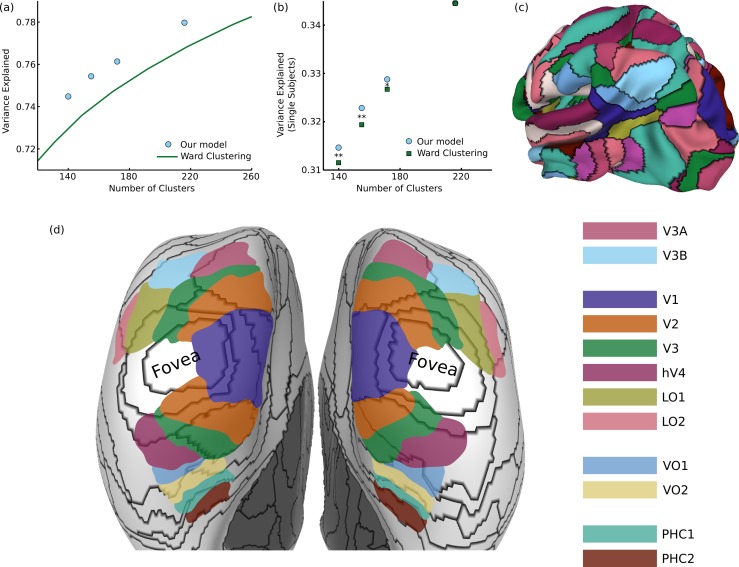
Figure 3. Results on functional brain connectivity.
(A) Our model consistently provides a better fit to the data than greedy clustering, explaining the same amount of variance with 30 fewer clusters (different points were generated from different values of the hyperparameter ). (B) When using our group-learned clustering to explain variance in 20 individual subjects, we consistently generalize better than the greedy clusters for cluster sizes less than 200 (∗ p < 0.05, ∗∗ p < 0.01). (C) A sample 172-cluster parcellation from our method. (D) Comparison between our parcels and retinotopic maps, showing a transition from eccentricity-based divisions to field map divisions.

