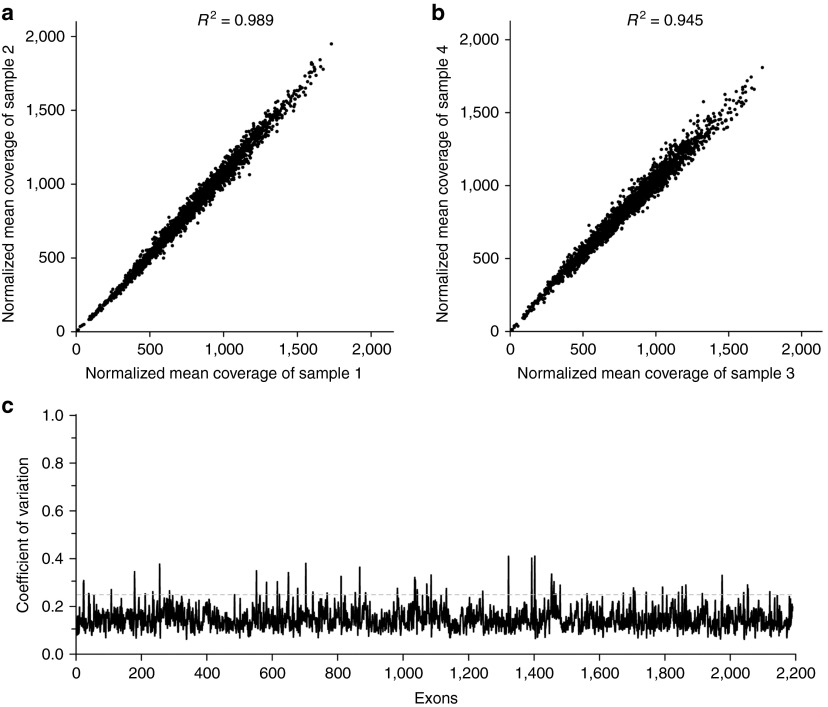
Figure 1.
Consistency of mean coverage among different samples and quality of the reference file. Correlation of normalized mean coverage of 2,134 exons in the 189-gene capture library of two arbitrary samples (a) from the same batch and (b) from different batches. (c) Distribution of the coefficients of variation (CVs) among 2,134 exons calculated from reference samples. The thin gray line indicates 25% CV.

