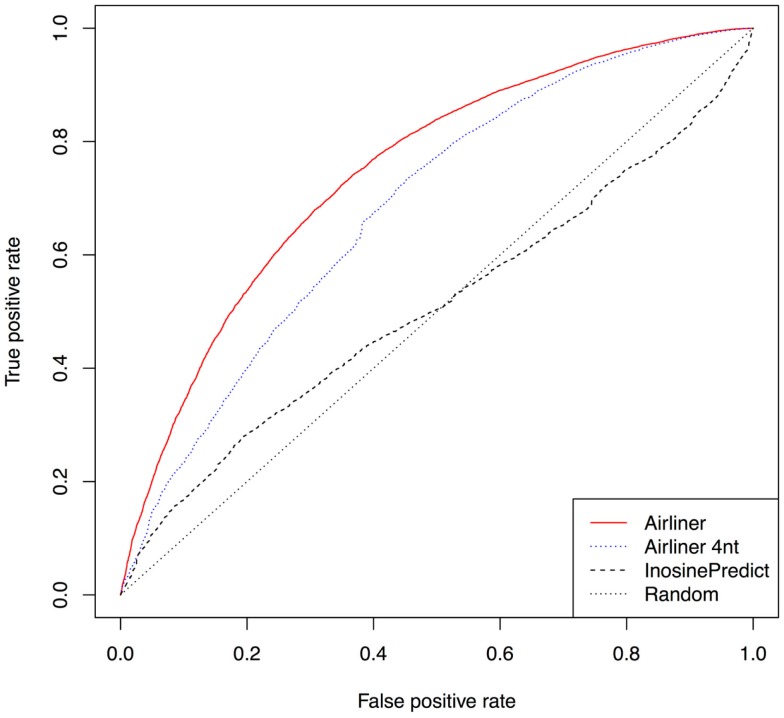
Figure 3.
Receiver operating characteristic curve (ROC) computed for the two prediction algorithms. We also provide a ROC curve for a variant of our algorithm (AIRlINER 4 nt), which takes into account only the flanking region of 4 nt around an adenosine. Such a curve is useful to compare the performance with our algorithm using the same flanking region. AIRlINER shows an average area under the ROC curve (AUC) equal to 0.7466, while InosinePredict gets an AUC of 0.5072. AIRlINER 4 nt has an AUC of 0.7464.

