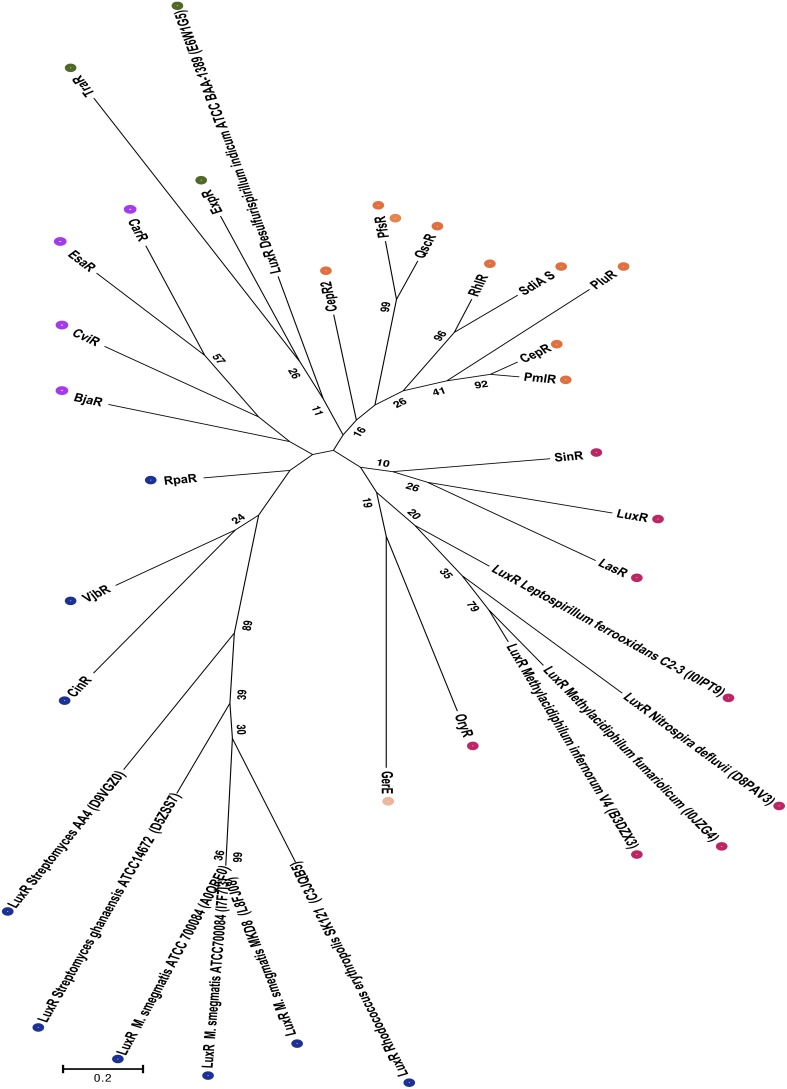
Figure 3.
Phylogenetic analyses of non-proteobacterial LuxR solos. This evolutionary history was inferred by using the Maximum Likelihood and the unrooted tree with the highest log likelihood is shown. The tree is drawn to scale, with branch lengths measured in the number of substitutions per site, and colored dots indicate different groups as discussed in the results section. The analysis involved 33 amino acid sequences, which included the 11 Non-proteobacterial LuxR solos indicated by their Uniprot identification in the figure. All positions containing gaps and missing data were eliminated. There were a total of 71 positions in the final dataset. Numbers in brackets indicate UNIPROT accession numbers for all proteins analyzed.

