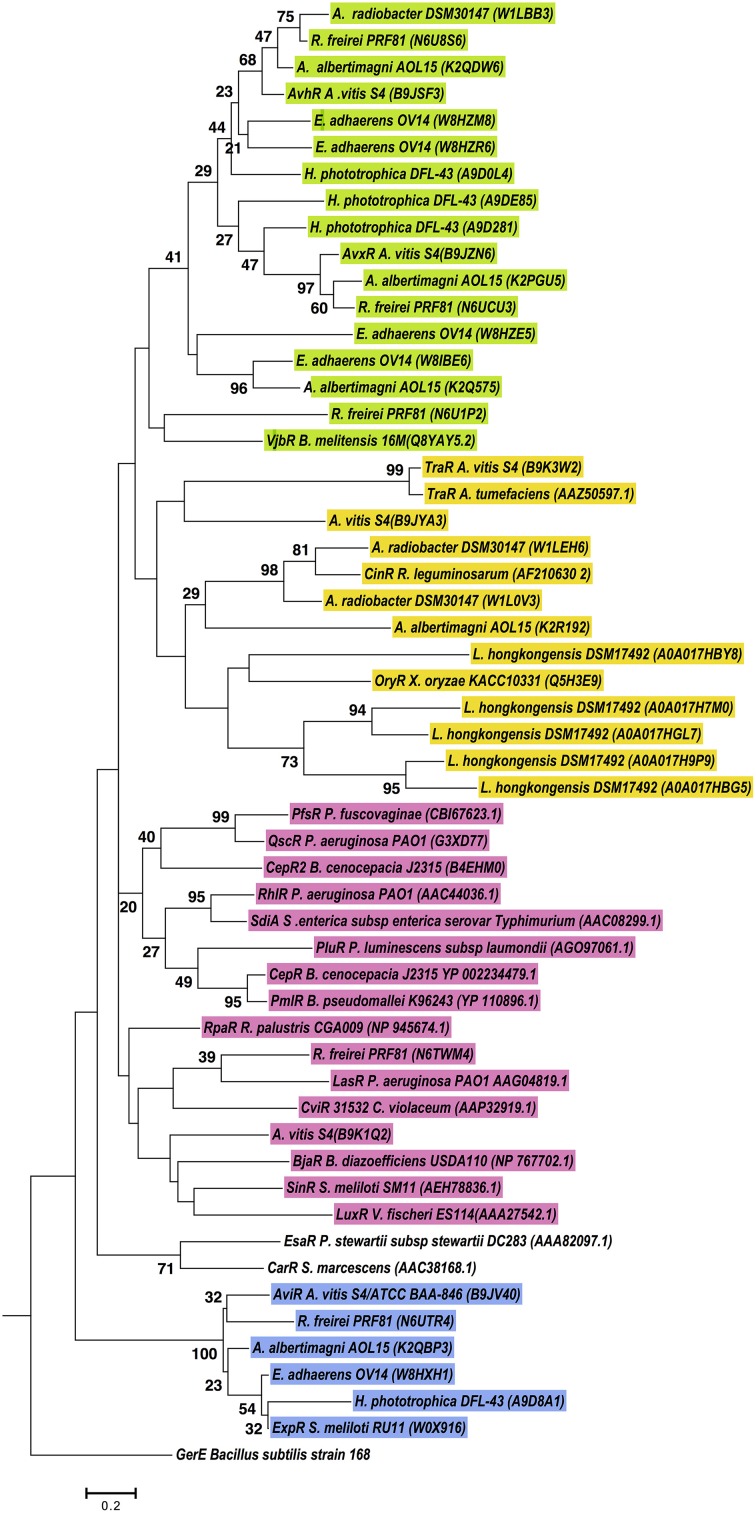
Figure 5.
Phylogenetic analyses of multiple LuxR solos carried by selected Alphaproteobacterial species. The tree was inferred by using the Maximum Likelihood method. Tree is drawn to scale, with branch lengths measured in the number of substitutions per site. The analysis involved 55 amino acid sequences, from representative species of this class carrying multiple LuxR solos. All positions containing gaps and missing data were eliminated. There were a total of 71 positions in the final dataset. Colors indicate major clusters.

