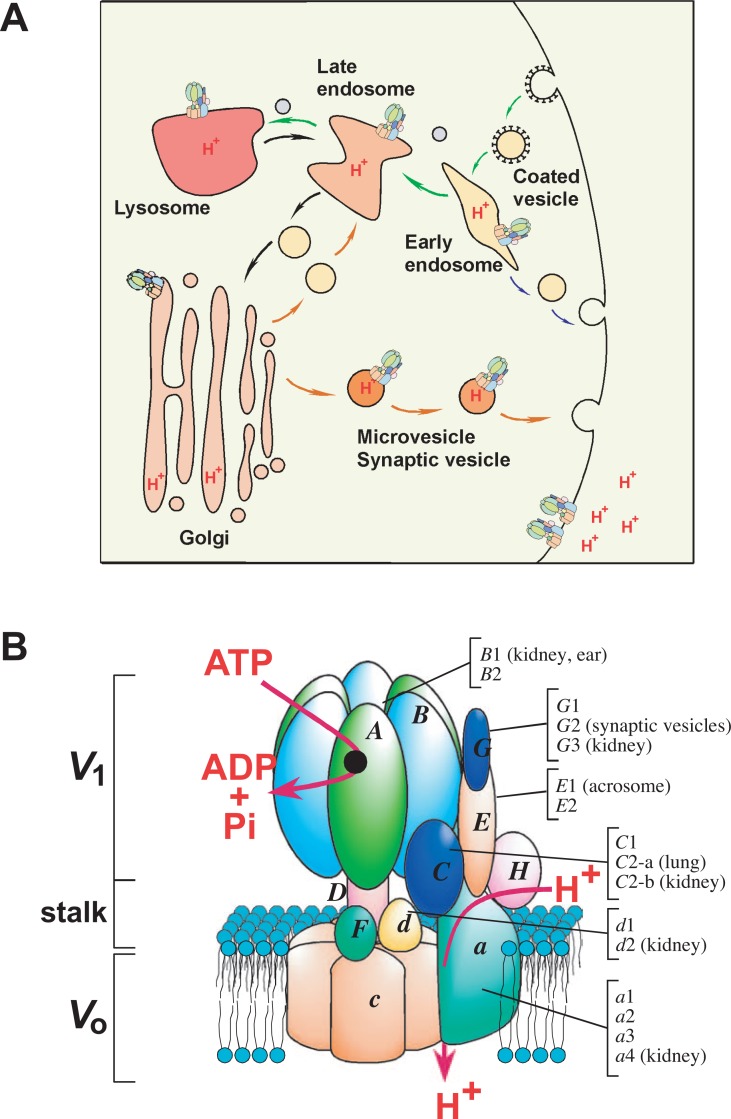
Fig. 8.
Localization of diverse V-ATPases in endomembrane organelles and plasma membranes. (A) Organelles are shown schematically together with endocytic and exocytic vesicle trafficking. V-ATPase localizations in endomembrane organelle and plasma membranes are shown. Examples of plasma membrane localization in osteoclasts and kidney proximal tubules are shown. Multiple V-ATPases are present in organelles and plasma membranes, although only one model is shown in each compartment because of space limitation. The luminal pH is more acidic when the cargo reaches its destination. Denser colors indicate more acidic pH. (B) A schematic model of a V-ATPase is shown together with mouse isoforms, including subunit a isoform a1, a2, a3 and a4. Tissue- or cell-specific isoforms are indicated. The isoforms not specified are ubiquitously found in mouse tissues. See text for references.

