
FIG 6.
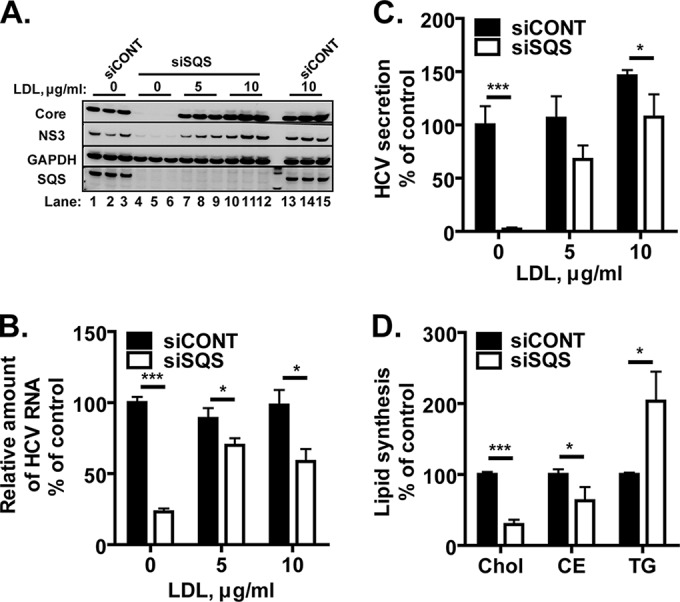
Anti-HCV effect of siRNA-mediated knockdown of SQS and its reversal by the addition of LDL. (A to C) Huh-7.5.1-8 cells were infected with HCV JFH-1 and then incubated in complete medium. On the first day postinfection, the cells were transfected with an siRNA for SQS (siSQS) or a control siRNA (siCONT), and then they were further incubated in serum-free medium that contained 0, 5, and 10 μg/ml of LDL for 4 days. (A) An equal portion of each cell lysate was subjected to immunoblotting for core, NS3, GAPDH, and SQS proteins. The results from one representative experiment performed in triplicate are shown. Similar results were obtained in two independent experiments. (B) Total RNA fractions were isolated from siSQS-transfected (white bars) or siCONT-transfected (black bars) cells, and then HCV RNA was quantified by RT-qPCR analysis using specific primers for the NS5B sequence. The amount of viral RNA relative to that of GAPDH mRNA is expressed as a percentage of the control value (siCONT without LDL) and plotted as a function of the LDL concentration. (C) The amount of secreted viral particles in each culture supernatant was determined by ELISA for the core protein. The concentration of core protein is expressed and plotted as in panel B. (D) Huh-7.5.1-8 cells were transfected with siSQS (white bars) or siCONT (black bars) and subsequently labeled using [3H]acetate in serum-free medium for 18 h. The lipid fractions were extracted from the cells and analyzed by TLC. The incorporation of [3H]acetate into cholesterol (Chol), cholesteryl esters (CE), and triglycerides (TG) was quantified and expressed as a percentage of the control value. Note that the value for cholesteryl esters of siSQS-transfected cells includes in part the incorporation of unidentified metabolites located immediately below the cholesteryl esters on a TLC plate. These metabolites accumulated only in siSQS-transfected cells for unknown reasons. The data in panels B, C, and D are means ± SD for triplicate samples from one representative experiment. Similar results were obtained in at least two independent experiments. *, P < 0.05; ***, P < 0.001.