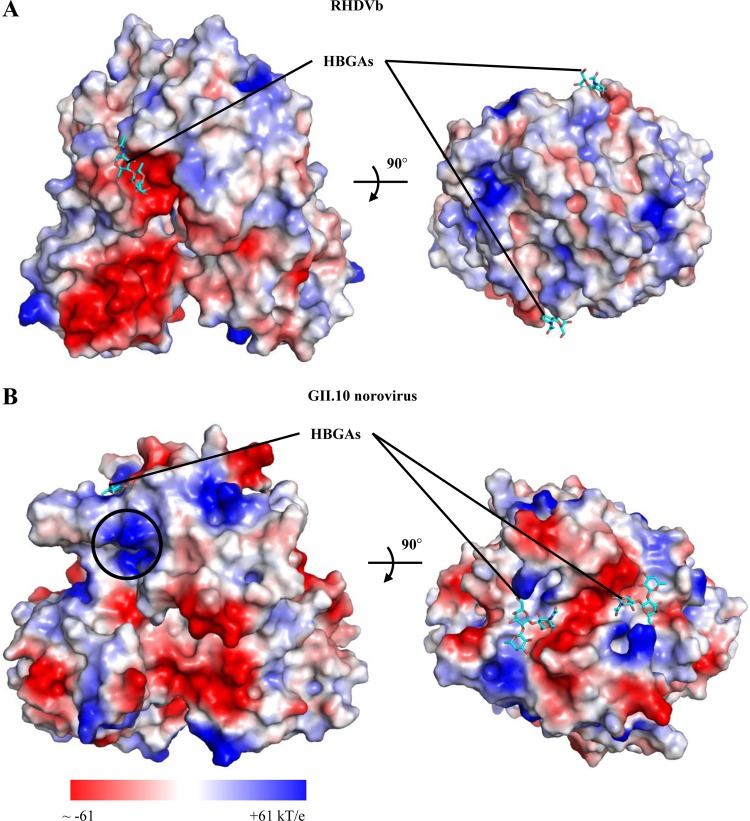
FIG 7.
Protein contact potential of RHDVb and GII norovirus P dimers. Surface representation of protein contact potential of RHDVb and GII.10 norovirus P dimers with bound H2-tri (a second H2-tri was modeled into the GII.10 P domain to show both HBGA binding sites). RHDVb and GII norovirus bound HBGAs at different sites on the P domains. RHDVb bound HBGAs on the side of the P domain, whereas GII norovirus bound HBGAs on the outer surface of the P domain. (A) RHDVb P dimer protein contact potential (−53 to +53 kT/e). The region surrounding the ABH-fucose of H2-tri was mainly negatively charged. (B) The GII.10 norovirus (3Q3A) dimer protein contact potential (−61 to +61 kT/e). The region surrounding the HBGA pocket was both negatively and positively charged. The black circle indicates the position on the GII dimer that would correspond to the RHDVb HBGA binding pocket.

