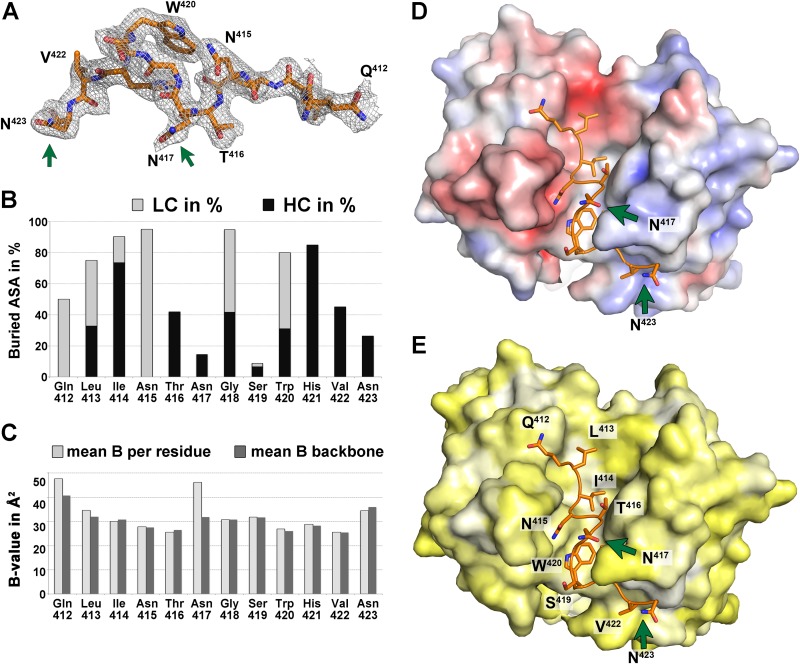
FIG 3.
Analysis of the peptide comprising aa 412 to 423. (A) Electron density of a composite omit map of the Fab 3/11-peptide complex contoured at 1 σ, allowing for manual building of the peptide model. The peptide is shown as sticks and is colored by atom type (orange, red, and blue for carbon, oxygen, and nitrogen, respectively). Green arrows indicate asparagine residues N417 and N423 that carry N-linked glycans in the infectious virus particle. (B) Percentages of accessible surface area (ASA) buried in the complex, calculated by using PISA (40), represented per residue as stacked columns for heavy (dark gray) and light (light gray) chains of Fab 3/11. (C) Average temperature factor values after crystallographic refinement of the peptide plotted per residue (light gray) and taking into account only backbone atoms (dark gray) illustrate that only the terminal peptide residues are less ordered, suggesting that they contribute less to antigen binding. In addition, the side chain of N417, the only really exposed residue, displays a higher temperature factor value. (D and E) The paratope of Fab 3/11 is shown as a molecular surface, and its peptide epitope is shown as sticks, colored as described above for panel A. The molecular surface of the paratope is colored according to its electrostatic potential (−5 kT/e [red] to 5 kT/e [blue]) across the molecular surface of the paratope, calculated by using the adaptive Poisson-Boltzmann solver (D) or according to a normalized hydrophobicity scale from white (hydrophobic) to bright yellow (hydrophilic) (E).

