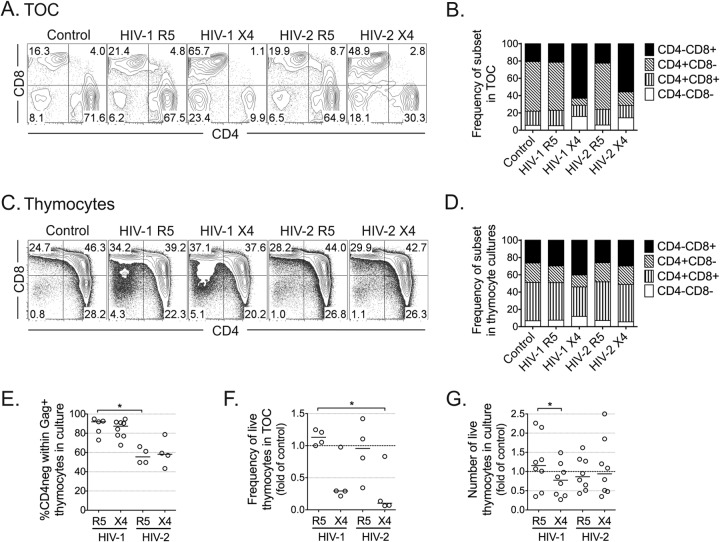
FIG 4.
Distinct cytopathic impact of HIV-2 infection on TOCs and thymocytes. HIV-infected TOCs (A and B) or thymocyte suspensions (C and D) were cultured for 10 days. Representative dot plots of CD4 and CD8 expression in cells in TOCs (A) and in total thymocyte suspensions (C), with the graphs showing the mean frequency of thymocyte subsets in all thymuses analyzed (n = 4 for panel B and n = 8 for panel D). TOC analysis was performed in CD14neg CD16neg CD19neg CD123neg cells. Dead cells and aggregates were excluded from the flow cytometric analysis. Numbers in dot plots represent the proportion of cells inside quadrants. (E) Frequency of CD4neg cells within Gag-positive (KC57 antibody-positive) thymocytes in HIV-infected thymocyte suspensions. (F) Fold change in the frequency of live cells in TOCs relative to that in the uninfected controls, as assessed by flow cytometry. (G) Fold change in the number of live thymocytes in culture relative to that in the uninfected control. Lines indicate median values. *, P < 0.05.

