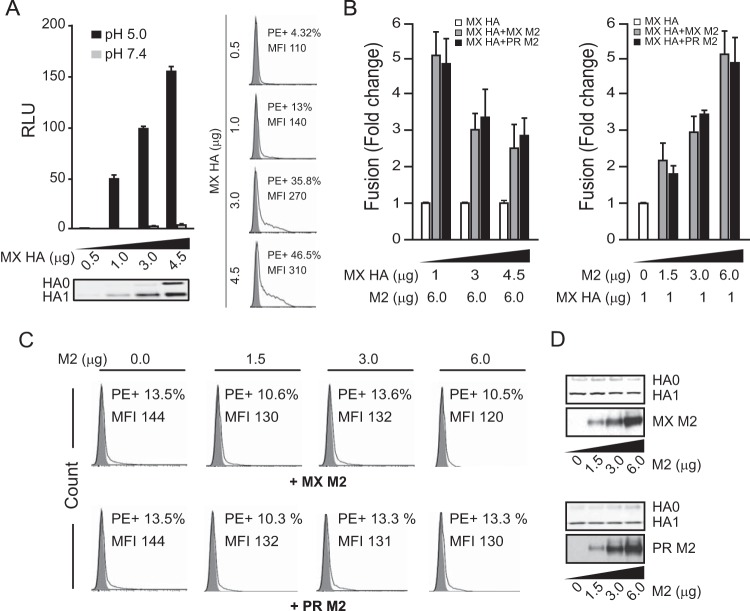
FIG 3.
M2 enhancement of HA-mediated cell-cell fusion. (A) Various levels of MX HA expressed in effector cells (0.5 to 4.5 μg of plasmid transfected) induced cell-cell fusion at pHs 7.4 and 5.0. The bottom left panel shows a Western blot of HA expression in effector cells. The right panels show a flow cytometry analysis of cell surface levels of HA in effector cells (0.5 to 4.5 μg of plasmid transfected). MFI, mean fluorescence intensity. (B) M2 enhanced MX HA-mediated cell-cell fusion at pH 5.0. (Left) A constant level of MX and PR M2 expression (6 μg of plasmid transfected) was tested with various levels of MX HA expression (1 to 4.5 μg of plasmid transfected). The fusion levels were normalized to the individual fusion levels induced by various HA levels without M2 expression. (Right) Various levels of MX and PR M2 expression (0 to 6 μg of plasmid transfected) were tested with a constant level of MX HA expression (1 μg of plasmid transfected). The fusion levels were normalized to the fusion level induced by HA alone without M2 expression. (C) Flow cytometry analysis of cell surface levels of HA in effector cells from the right part of panel B. The MX HA levels on the cell surface with various levels of MX M2 expression are shown in the top panels. The bottom panels show MX HA levels on the cell surface with various levels of PR M2 expression. (D) Western blots of total HA and M2 expression in effector cells from the right part of panel B. The top panels show MX M2 expression with various amounts of transfected DNA. The bottom panels show PR M2 expression with various amounts of transfected DNA. HA0 and HA1 were detected with rabbit HA1 antiserum. MX and PR M2 proteins were detected by use of M2-specific rabbit antiserum. Cell-cell fusion data are shown as means and standard deviations for three independent experiments.

