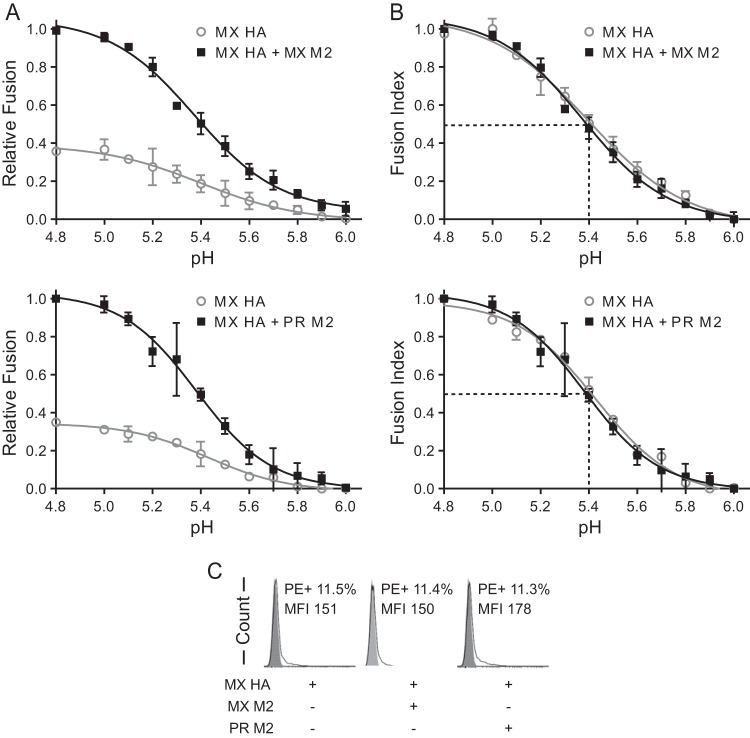
FIG 4.
M2 enhancement of MX HA-mediated cell-cell fusion across a range of pH values. (A) Relative cell-cell fusion levels mediated by MX HA at various pHs in the presence or absence of MX M2 (top) or PR M2 (bottom). For determinations of relative fusion, the fusion levels were normalized to the maximum fusion obtained with MX M2 (top) or PR M2 (bottom). (B) Fusion index comparisons. Fusion levels in each curve from panel A were normalized to the maximum fusion level for that curve. For example, the individual fusion levels at different pHs in the curve for MX HA were normalized to the maximum fusion level in the curve for MX HA. (C) Flow cytometry analysis of cell surface expression of HA in the effector cells used for panels A and B. Fusion data are shown as means and standard deviations for three independent experiments. Plasmids used for transfection included 1 μg of MX HA plasmid and 3 μg of M2 plasmid.

