
FIG 1.
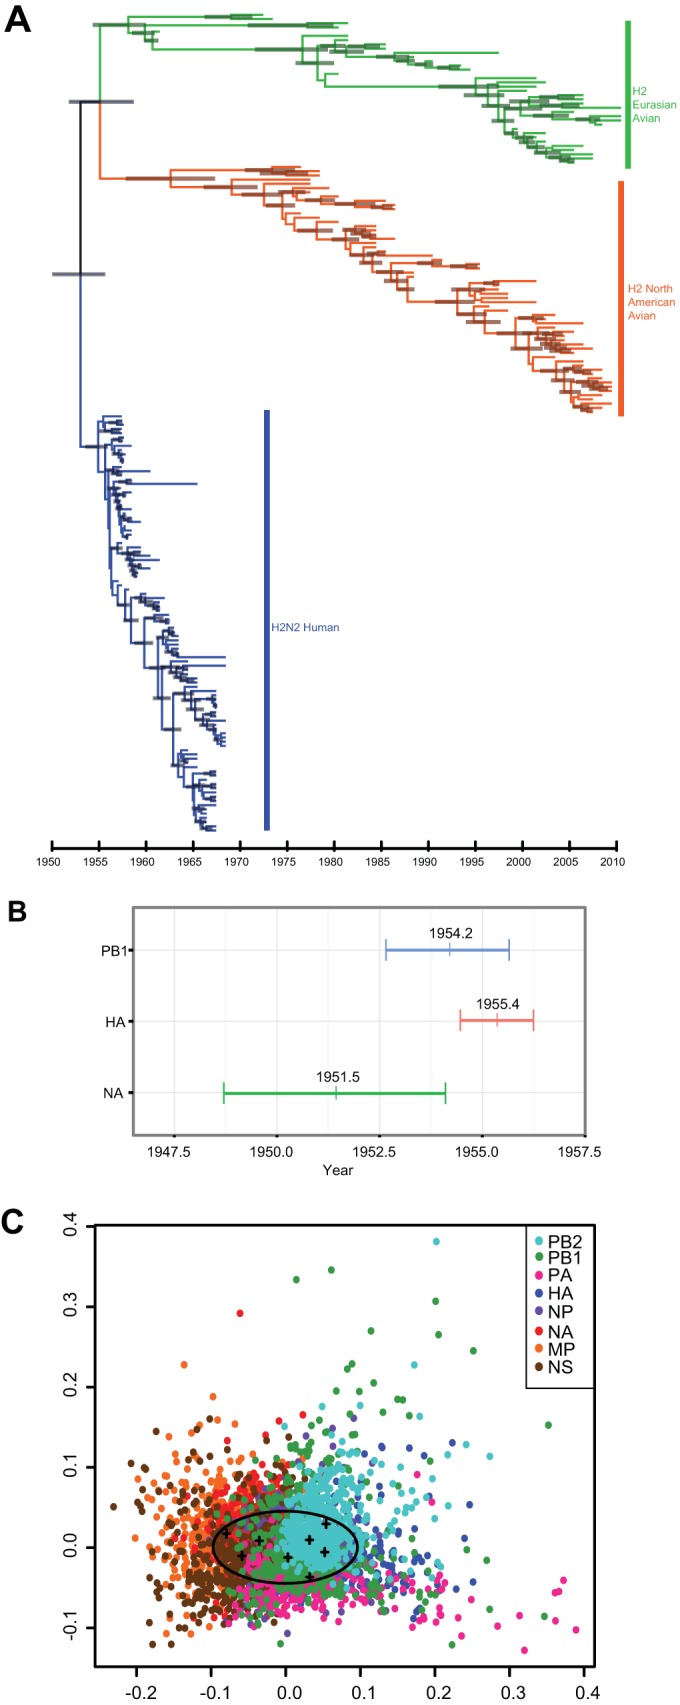
Evolution and reassortment of H2 viruses. Maximum-clade credibility temporal tree of H2N2 influenza A virus segment. (A) HA of Eurasian avian (green), North American avian (orange), and human (blue) virus isolates (n = 194). Gray bars represent the 95% highest posterior density (HPD) of age for each node. (B) Ninety-five percent HPDs of times to most recent common ancestor (TMRCAs) for avian-derived H2N2 human segments PB1 (blue), HA (red), and NA (green). Mean TMRCA values are indicated at the center of each bar. (C) Multidimensional scaling (MDS) plot of uncertainty of TMRCAs between samples of 500 trees for each segment of pandemic H2N2 viruses (n = 49) sampled between 1957 and 1968. In this analysis, the tree-to-tree variation in posterior distribution of 500 trees for each segment is plotted as a cloud of points where the mean is represented by the centroid of the cloud (crosses), while the spread of points indicates the degree of statistical uncertainty in the phylogenetic history of each gene segment. The space occupied by human H3N2 viruses is indicated by the oval (15).