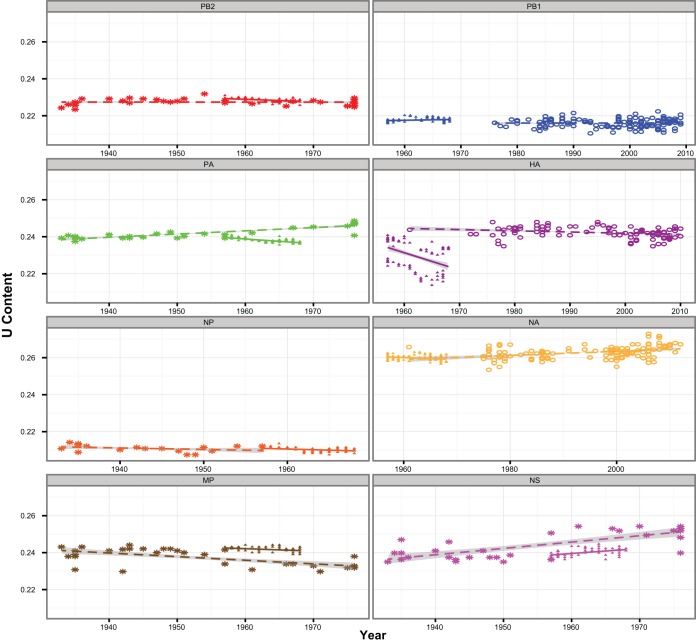
FIG 2.
Uracil content patterns. Uracil content in H2N2 human (solid triangles) gene segments in comparison to the respective H2 avian (asterisks) or H1 mammalian (open circles) isolates from which each segment is derived, depicted per year. Best-fit regression lines are shown with the 95% confidence interval shaded gray.

