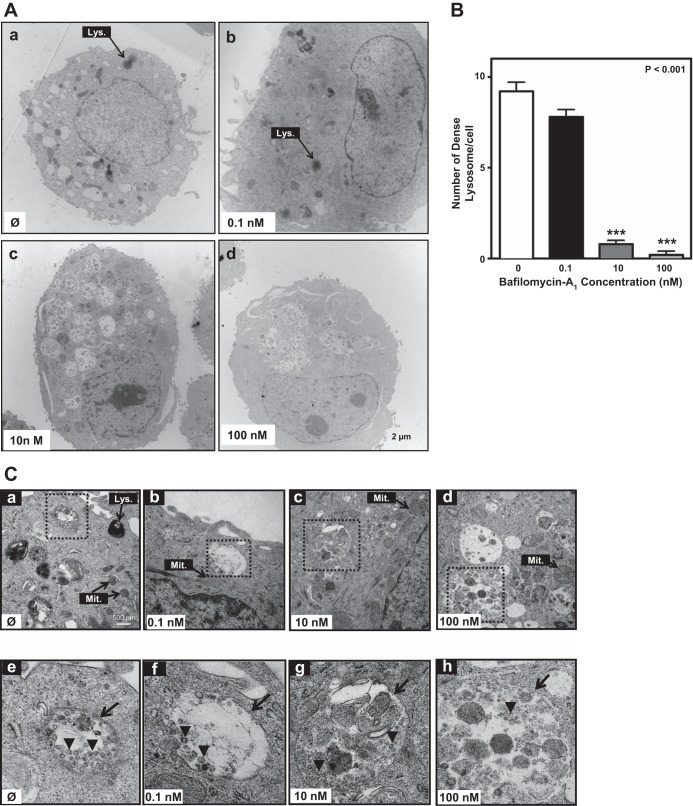
Fig. 5.
Ultrastructural changes in A549-infected cells pretreated with Baf-A1. A549 cells were treated with Baf-A1 (0–100 nM, 24 h), then infected with A/PR/8/34 virus (MOI 5 PFU/cell), and transmission electron microscopy (TEM) analyses were performed 24 h thereafter. A: TEM photomicrographs showing typical ultrastructural features (organelles, nucleus), including darkly stained lysosomes (Lys; arrow) in control (Ø) cultures (no infection, no Baf-A1) (Aa). Lysosomes are readily seen in infected cells cotreated with 0.1 nM Baf-A1 (Ab, arrow), but are absent in cells treated with 10 nM (Ac) or 100 nM Baf-A1 (Ad). Scale bar for all images is shown at bottom right of Ad. B: bar graph shows quantitative analysis of the number of darkly stained lysosomes (described in materials and methods) in A549 cells under the conditions noted for images in A above. ***P < 0.0001 vs. control conditions (0) (no infection, no Baf-A1 treatment). Results are expressed as means ± SD of total numbers of lysosomes in images captured from 4 different cells. C: high-power TEM micrographs of A549 cells showing mitochondria (Mit.) and lysosomes under the same conditions described for A. Scale bar for Ca–Cd is shown in the lower right corner of Ca. With increasing Baf-A1 concentration there is loss of lysosomal structures, mitochondrial swelling, and increased vacuolation. Boxed areas (hatched lines) identify regions that are enlarged in the corresponding panels (Ce–Ch) in the lower row of images. Arrowheads in each panel point to viral particles within autophagosomes. Arrows in Ce and Cf identify double-membrane autophagosomes. In Cg and Ch the arrows identify disorganized-membrane autophagosomes.

